Free Gradebook Template
This free Gradebook Template for Excel started out as a very basic grade book spreadsheet, but it has evolved into something that is very useful, flexible, and powerful (and still free). We now have a few different types of grade books that can handle most of the major grading systems used in high school and colleges.
For new teachers: I've included a lot of information on this page about how to use the grade book. There are some details that I wish I would have known my first time.
Some of the features that make this template particularly useful are the ability to mark excused assignments, hide/show names or IDs, apply different weighting to homework and exams, apply a simple curve to the final grades, and make adjustments to the grading scale. In addition, because the gradebook is in Excel rather than an online gradebook system, you can add cell comments and format cells to highlight specific grades.
You may also want to check out the Class Attendance Tracking template.
Gradebook Template : Percentage System
This system is commonly used in high schools and for courses that involve more subjective grading like art and literature. On each assignment, the grade is recorded as a percentage. The percentage might be a calculation, such as earning 25 out of 30 points. Or, the percentage might be recorded based on performance or a subjective letter grade. The nice thing about this system is that you can use whatever method makes sense for a particular assignment. If you are unsure what template to use, I would suggest using the percentage-based version.

Download
⤓ Excel (.xlsx)License: Educational Use (not for distribution or resale)
Weighting Factors vs. Points: If you use total points for the weighting factors, then the percentage system is almost exactly the same as the point-based system, except that you are recording grades as percentages, and doing the calculations for each assignment by hand.
Converting Letter Grades to Percentages: The grading scale is used to define the minimums for each grade. However, when recording an "A-" you would reference a different conversion chart. For example, instead of recording an A- as a 90% (the minimum), you might record it as a 92%.
Extra Credit - Giving extra credit using this system requires assigning the extra credit to specific assignments (such as giving a score of 110%).
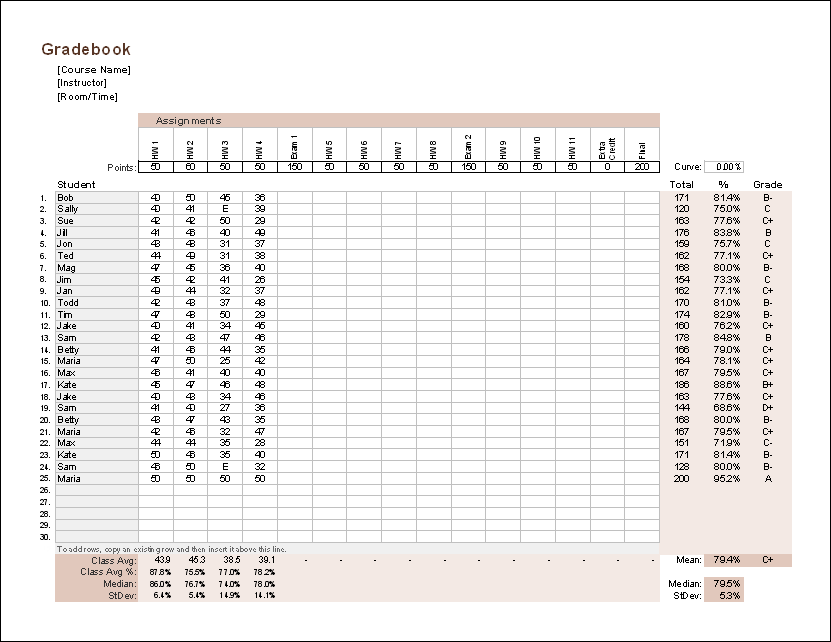
Gradebook Template : Point System
In this version, the grading scale is percentage-based (A>=90%, B>=80%, etc.), but in the Gradebook worksheet you enter the number of points earned on each assignment or exam. This system is often used college courses such as science, math, and engineering.
Extra Credit: The values listed in the Points row in the Gradebook worksheet do not necessarily represent "maximum possible" points. For an extra credit assignment, you would enter a "0" in the Points row. Or, if you allow extra credit on a specific assignment, the student might earn a higher score than the one listed in the Points row.
Download
⤓ Excel (.xlsx)Weighted Assignment Types
Version 1.3.2⤓ Download (BETA)
For: Excel 2010 or later
Important! (11/24/2015) - Version 1.3.0 of the file gradebook_points_weighted.xlsx should be considered a BETA version (i.e. higher than normal probability of containing errors). Versions downloaded prior to 11/24/2015 contained errors in the weighting for different assignment types and this version was designed to fix that. Make sure you are using the latest version (at least 1.3.0) and let me know if you find any problems.
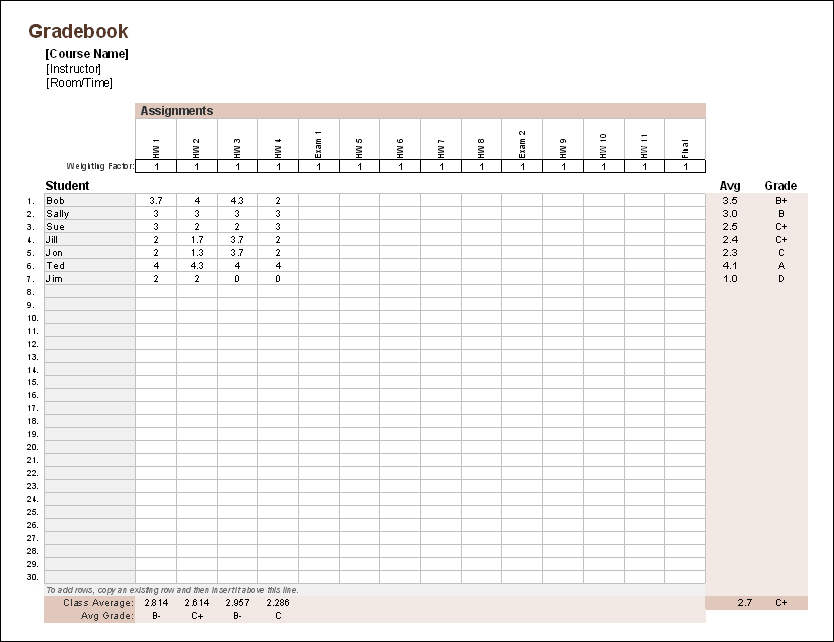
Gradebook Template : GPA System
In this version, both the grade scale and the recorded grades are based on a 4.0 grade point system. This type of system might be used by a class in which all grades are subjective and the grading on each assignment is by letter grade. I would have liked to make the template work so that you enter the actual letter grades, but that turned out to be too complex, so instead, the grades are recorded by converting the letter grade to the equivalent point value.
Recording Failing Grades: Unlike the percentage grade scale where failing grades are entered as 50% or half the points, a failing grade is entered as a 0, because the scale is set up so that F=0 and A=4 averages to a C=2.
Important Tip
Have you ever lost all your grades because of a corrupted spreadsheet or lost file? Well, it rarely happens but it does happen, so follow this tip:
How to Use the Grade Book Template
Although some help information is included in the worksheets, I've included additional information about how to use the templates below. The items below are listed generally in the order that you would need to perform the various actions. Regardless of the system you use for grading, remember that grades you give should be Fair and Defendable (see [1] below).
1. Define a Grading Scale

To avoid confusion or possibly complete chaos, teachers should be very clear about how students will be graded. The grading scale is often outlined in the course syllabus, depending on how structured the course is. College students will usually want to know how many assignments and exams there will be as well the points or weighting associated with the home work and exams.
Each of the spreadsheets contains a worksheet for defining the Grading Scale, depending on the chosen grading method (see below).
2. Add/remove students in the Names and Gradebook worksheets
The grade book template is designed to make it easy to customize the spreadsheet for the size of your class. In the Names worksheet as well as the Gradebook worksheets, when inserting or removing students, you should insert or remove the entire row (right-click on the row number to bring up options).
3. Displaying Student Name vs. ID
It is important to allow students to see their progress. However, students usually like to keep their grades private to avoid heckling from other classmates. So, I've built into the spreadsheet a checkbox for switching between student names (for the teacher's convenience while recording grades) and custom student IDs (to maintain some privacy when displaying the grades to students).
Creating Random IDs: First, enter the Names of the students in the Names worksheet. Second, assign random (but unique) numeric IDs. Then, select all the Names and IDs and use the Excel sort feature to sort the list by ID.
4. Add/remove assignments
You can add or remove assignments by simply copying the entire column for an existing assignment and then pasting that column somewhere between the first and last assignment column. It is important that you do not paste the new column AFTER the last assignment because if you do that, the formulas will not automatically stretch to include the new column.
5. Weighting homework/quizzes/exams
It is fairly common, especially in college courses, to make the exams, quizzes, homework, the final, and class participation each a specific percentage of the final grade. For example, the breakdown might be homework=25% of the grade, midterm=25%, quizzes=15%, and the final=35%.
In favor of simplicity and flexibility in my spreadsheets, instead of calculating each of these totals separately then combining them to get the final grade, each assignment is given either a number of points or a weighting factor. See Weighted Mean on wikipedia.com for a mathematical description.
Example 1: Relative Weighting - If you wanted an exam to be equivalent to 5 homework assignments, in the Gradebook worksheet you could set the weighting factors on the homework to 1 and the weighting factor for the exam to 5. Or, using the point system, the exam would be worth 5 times as many points as a homework assignment.
Example 2: Using Total Points - The number of points for each assignment can be used as the weighting for determining what percentage of the overall course grade comes from homework, exams, quizzes, etc. For example, if a typical homework assignment is 25 points and you have 10 of them, the total points for homework is 250. To make the exams worth 50% of the grade, you just need to make the total points for the exams equal to 250, also.
6. Recording grades in the Gradebook worksheet
Excused Assignments: To record an incomplete assignment as excused, you can either leave it blank or enter an "E" or "e" (not case sensitive).
Adding Comments: One nice thing about using Excel is that if you need to include any comments about specific assignments, you can add a comment to the cell (right-click on the cell and select Insert Comment). This comment won't get printed, but it can be useful for you as the instructor. For example, you might want to include a comment about why a particular assignment was excused for a student.
Dropping Low Grades - If your policy is to take the best of 3 exam grades, then this can be handled easily by changing the lowest exam grade to an "E" for "excused". You should probably add a comment so you can keep a record of the actual score earned on that exam.
Guideline for Failing Grades: If you are using the Percentage or Point based grading system, a failing grade is typically less than 60%. However, if a student misses an assignment or scores less than 50%, you should record the grade as 50% or half the points for that assignment. Why? On a typical 4-point GPA scale, F=0 and A=4, so the average between an F and an A is a C=2. If you are using a percentage or point based grading scale, is the average between a 0% (F) and 100% (A) also a C? No, the average would be 50%=F. An Exception: Teachers might choose to give a 0% in order to penalize students for not turning in assignments and to discourage laziness. This would also distinguish a student who didn't do anything from one who struggles but only scores a 50%.
7. Final Adjustments to the Grading Scale
At the end of the course, the teacher usually looks at the grades for the entire class and might make adjustments to the grading scale depending on the class average and distribution of grades. Adjustments are normally only made to raise low grades. Lowering higher grades just makes students angry. The histogram of grades and class average come in handy at this point. When making adjustments, it is vital to remember to make the grades Fair and Defendable - meaning that you as the teacher can defend the grades you give when hounded by students, parents, the department head, or the school board.
Simple Curving: Instead of (or in addition to) making adjustments to the grading scale, you can use the Curve field in the Gradebook worksheet to increase all the final grades by a certain percentage. If you are aiming for a target class average, you can use goal seek to set the Mean percentage to the target value by changing the curve percentage. The curve field is not included in the GPA-based spreadsheet.
Example 1: If a student's overall percentage was 79.9%, but the cutoff for a B- is 80%, the teacher might decide to change the minimum percent for a B- to 79.9%. To be fair, the teacher might want to shift all minimums down 0.1% in this case (this would also make the changes more defendable).
Example 2: The policy in department X is to allow 15% of the grades to be A's (including A-, A, and A+). You can determine the minimum score for an A- by calculating the 85th Percentile and then shift the grading scale.
8. Assigning Final Letter Grades
The assignment of the final letter grade in the Gradebook worksheet is done automatically based on the grading scale defined in the Grades worksheet. For the formulas to work correctly, the Grading Scale must be ordered from lowest to highest.
Grading on a Curve
These gradebooks are not designed to automatically grade on a curve. However, what I have described above in "final adjustments to grading scale" is one method for adjusting grades based on a curve.
A Little Background: A common approach to grading on a curve is to first order all the final grades from highest to lowest. Then, you assign A's to the top 10%, B's to the next 23.5%, C's to the next 33%, D's to the next 23.5%, and F's to the lower 10%. These percentages represent a symmetric bell curve for the ABCDF grading system with a C average, but the values will depend on how many A's you are allowed to assign and whether or not the distribution is symmetric. For example, if you can give 10 A's, do you really want to give 10 F's?
The bins for each grade will be different widths. For example, in a 100-point scoring system, the A's may span from 80 to 100, while the B's might be 77 to 79.9 and C's might be 60 to 76.9.
An alternative to ordering the grades (something that the gradebook template doesn't do for you) is to determine the cutoff scores by calculating percentiles and altering the grading scale accordingly.
Using Percentiles: A Percentile is defined as a value below which a certain percent of values fall. For example, 90% of the students score less than the 90th Percentile value.
Let's say that you can assign A's to 10% of the students (including A-, A, and A+). To find the minimum score for an A-, you calculate the 90th percentile using the following Excel formula, where final_scores is the range of cells containing the final student scores.
Plus and Minus Grades (Chromatic Variants): When grading on a curve, the cutoff scores for the plus and minus grades (A-, B+, B-, etc) might be subjective or you might use the system where the minus scores make up the lower 30% of the letter grade and the plus scores make up the upper 40% of the letter grade to correspond with the GPA system. I have built these formulas into grading scale table in the template. However, you can manually enter your own cutoffs.
Applying Weighting to Different Assignment Types
Teachers may sometimes want to make different types of assignments worth a certain percentage of the final grade, such as Homework=30%, Exams=50%, and Attendance=20%. The file gradebook_points_weighted.xlsx has been designed for this purpose.
Final Grade: The final grade is calculated by multiplying the category weight times the category score and adding the results for each category. For example, if the weighting is Homework=60% and Exams=40% and a student's scores are 80% for homework and 75% for exams, then the final grade is 60%*80%+40%*75%=78%.
Extra Credit: In theory, extra credit can be earned by giving a student more points on an assignment than are available for that assignment, although the weight of that type of extra credit is difficult to determine. Defining specific extra credit assignments makes it easier to define the weight of the extra credit on the final grade. For example, if extra credit assignment #1 can increase your final grade by 2%, and a student earned 50/100 of the points possible, their final grade would be increased by 1%.
Scores per Category: The percentage score for each category is calculated by dividing the total points earned by the total points available for that category. Ungraded, excused, or dropped assignments are not included in these totals. Assignments within a category can be given different weights by giving each each assignment and different number of points possible (such as a final worth 150 points and a mid-term worth 100 points).
Dropping Lowest Scores
Dropping the lowest exam score or quiz score is a popular way to make students happy, but weighting factors can complicate this. If you give 3 exams and allow the lowest score to be dropped, it is easy to figure out which one to drop IF all exams are worth the same number of possible points - you drop the assignment with the lowest % score (or lowest points earned - it will be the same).
What if the exams have different weights, how do you know which one has the largest negative effect on the grade? Consider the following scenario in which the overall exam score is calculated as the Total Points Earned divided by the Total Points Possible:
- Exam A scored 15/20 = 75% (-5 points)
- Exam B scored 38/50 = 76% (-12 points)
- Exam C scored 85/100 = 85% (-15 points)
The overall exam score is (15+38+85)/(20+50+100)=81.2%.
Which one do you think should be dropped, the lowest % score (Exam A) or the score with the largest point loss (Exam C)? Trick question. The answer is B (for this specific scenario).
- Drop Exam A: (38+85)/(50+100) = 82%
- Drop Exam B: (15+85)/(20+100) = 83.3%
- Drop Exam C: (15+38)/(20+50) = 75.7%
The point is ... if you are going to drop a score, keep things simple by making each of the assignments worth the same number of points.
References and Resources
- [1] "Beginner's Guide to Figuring Your Grades" by Scott Mandel, Ph.D., originally found on educationoasis.com
- [2] Grading on a Curve at wikipedia.com
- Grading Systems at wikipedia.com
- TeacherPlanBook - Paul Shuster from TeacherPlanBook.com helped me figure out a bug in Excel for Mac that was affecting the weighted gradebook. I also created the Google Sheets versions at his request.
