How to Make a Gantt Chart in Excel
This video series runs through the process of creating a Gantt Chart in Excel from scratch. It starts with a basic Gantt chart and then builds more and more features, teaching intermediate and advanced Excel skills in the process.
The purpose of these videos is to teach intermediate-to-advanced Excel techniques by showing the creation of a useful tool. The purpose isn't to replace the Pro version, or to suggest that Excel is the best way to create a Gantt chart. However, I'm guessing that you'll get a LOT more out of this video series than you paid for!
If you like this series, please support Vertex42 by liking the videos, commenting, subscribing to the channel, and of course purchasing the Pro version 😀. Thank you!
Remember, if you don't want to make a Gantt chart in Excel from scratch, you can just download a Free Gantt Chart or purchase Gantt Chart Template Pro.
Download the Files: The files I created in these videos can be downloaded as bonus files when you purchase Gantt Chart Template Pro.
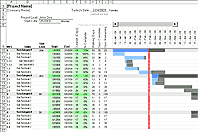
PART 1 - Making the Simple Gantt Chart From Scratch
This video demonstrates how I created the Simple Gantt Chart using conditional formatting to make a scrolling timeline. You'll also learn how to show the progress of each task.

How to Make a Gantt Chart in Excel:
- 0:20 Start with a List of Tasks and Dates
- 0:44 Set up the Timeline Labels
- 2:20 Add Initial Formatting to Style the Gantt Chart
- 4:05 Add the Bars of the Gantt Chart via Conditional Formatting
- 5:10 Make the Timeline more Dynamic
- 6:28 Add a Scroll Bar Form Control
- 7:20 Highlight Today's Date using Conditional Formatting
- 7:51 Add Columns for 'Assigned To' and Progress (% Complete)
- 9:07 Show Progress in the Gantt Chart by Shading a Portion of the Bars
- 11:31 Define Print Settings
Part 2 - Working with Workdays
This video shows how to use the WORKDAY, NETWORKDAYS, WORKDAY.INTL, and NETWORKDAYS.INTL functions to handle projects where there is no work being done on weekends or holidays. You'll learn how to create conditional formatting rules to highlight weekends and holidays, and of course a lot of other neat tricks.

Part 3 - Dynamic Display Options
This video shows various methods of changing the display, starting with narrowing the columns, extending the number of columns, and printing on multiple pages. Then, you'll see how to create a stacked bar chart to view the entire project schedule in a single chart. The second part of the video shows how to modify the formulas and conditional formatting rules to change the display to daily, weekly, monthly and quarterly.

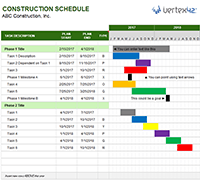
Part 4 - Color Coding
This video shows how to modify the color of the bars in the gantt chart by choosing a color from a new Color column, color coding based on the Lead name, and highlighting overdue tasks. You'll see the creation of another relative named range, the use of the INDEX function to return a column from a table, a checkbox to turn the highlighting on and off, and how to avoid splitting CF rules when you copy and paste.

Part 5 - TBD
Stay Tuned! I haven't decided what this one will be about yet. It might be to show an example of resource planning. Subscribe to the Vertex42 Channel and turn on notifications (click on the bell).
Meanwhile, to see an example of summing number of workers per day, you can download the Daily Construction Schedule Template.