Simple Gantt Chart
Create a project schedule in Excel or Google Sheets with an easy-to-use template. Simply enter your tasks and start and end dates. This template uses conditional formatting to generate a Gantt chart like our original Gantt Chart Template, but it has you enter start and end dates instead of start date and duration, and it doesn't require you to copy any formulas. You can add formulas if you want to calculate duration or create task dependencies, and you can read below to learn how to do that, but the point of this design was to keep things as basic as possible.
Simple Gantt Chart
for Excel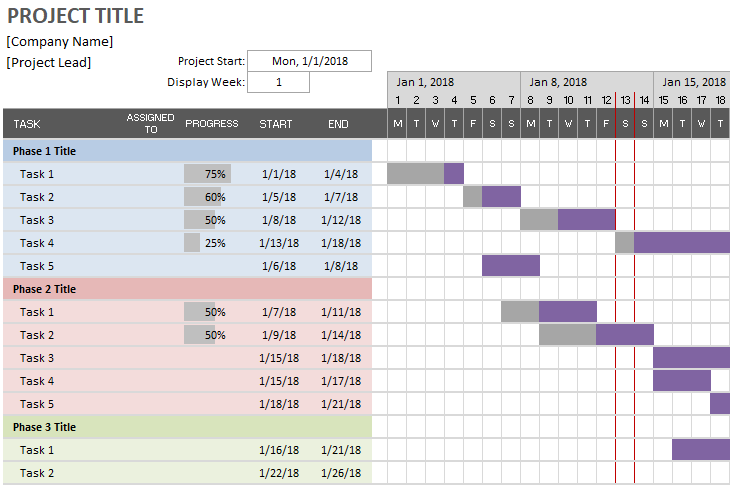
Download
⤓ Excel (.xlsx)License: See the Private Use License (not for distribution or resale). This template has been licensed to Microsoft for distribution via their apps and template gallery.
Update (4/24/2019): Added a "Today:" field at the top for entering the date to use for the vertical red line. Enter =TODAY() if you want the date to update automatically.

NEW AI-Assisted Gantt Chart
for Excel, with AI Assistant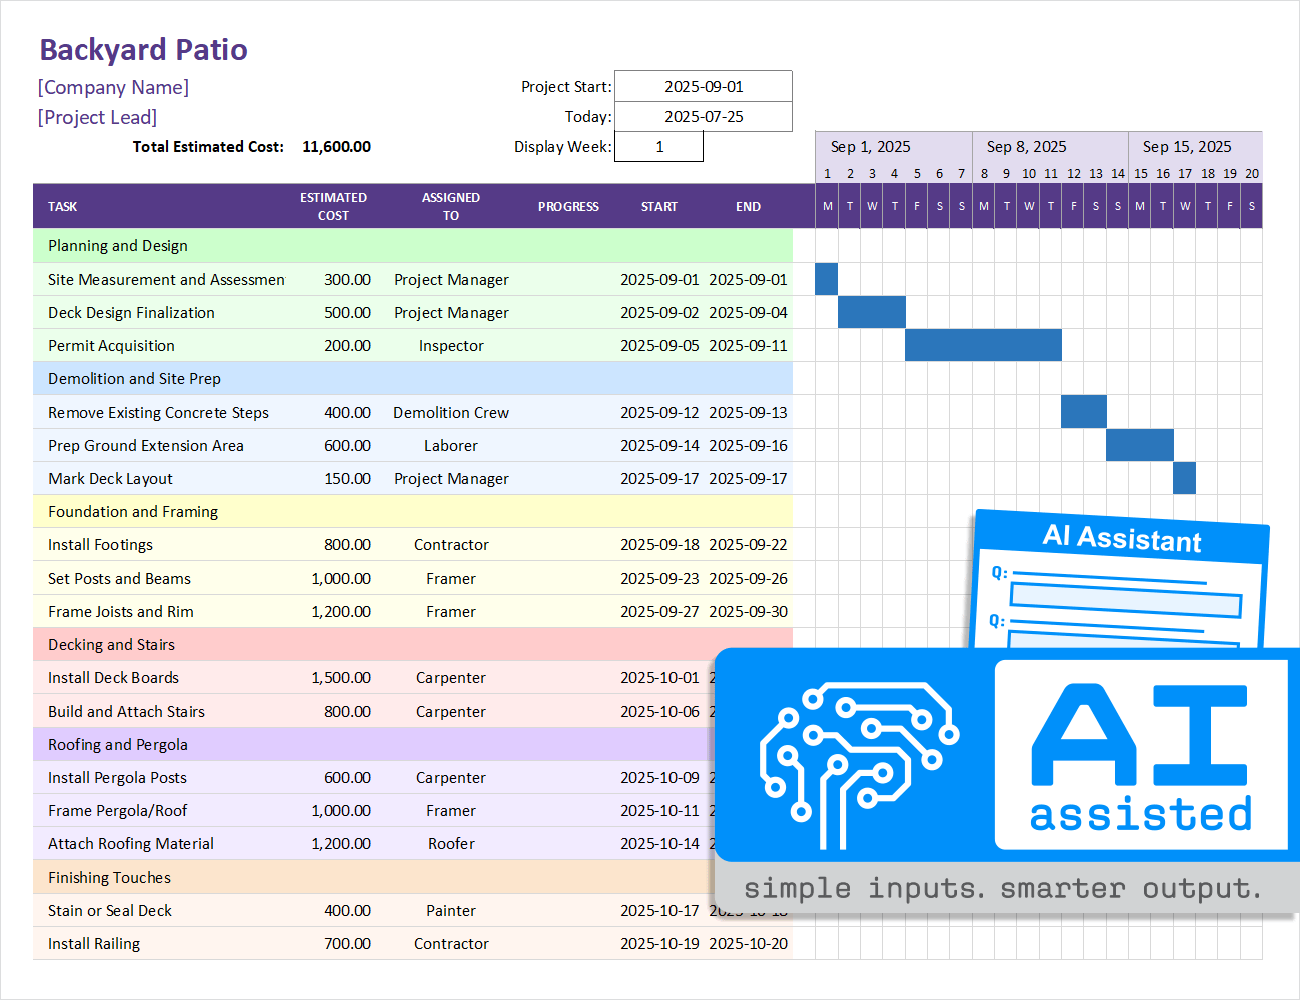
Download
⤓ Excel (.xlsx)License: Private Use (not for distribution or resale)
Description
Use AI to help you generate a sample schedule for your project. Answer a few questions, then copy/paste a prompt into ChatGPT. The example in the screenshot was generated by AI for a Backyard Patio project.
New AI-Assisted Template: This version of the simple gantt chart was designed to work with AI assistants like ChatGPT to help you populate the schedule with a set of tasks based on the description of your project. The AI will also attempt to estimate some of the costs for each task.
Our testing so far has shown ChatGPT to be a bit finicky, so this template and the results should be considered experimental only.
Remember that AI has a tendency to make up fake answers, so always verify results and modify as needed.
What is a Gantt Chart?
A Gantt chart is a tool for project management developed by Henry Gantt in the early 1900s. It uses horizontal bars to show the periods of time when each task or resource has been scheduled. It may also show the portion of work completed, task dependencies, milestones, and other data.
A vast number of software applications have been developed for project management, and most of these use a Gantt chart to visualize the project schedule. However, if you don't need all the bells and whistles of these applications, a spreadsheet can be a simple solution.
- Enter Work Days, Calendar Days, or End Date
- Choose Different Colors for the Bars
- Select a Daily, Weekly, or Monthly View
- Create Task Dependencies Easily
- Exclude Holidays from Work Days
Simple Gantt Chart
for Google Sheets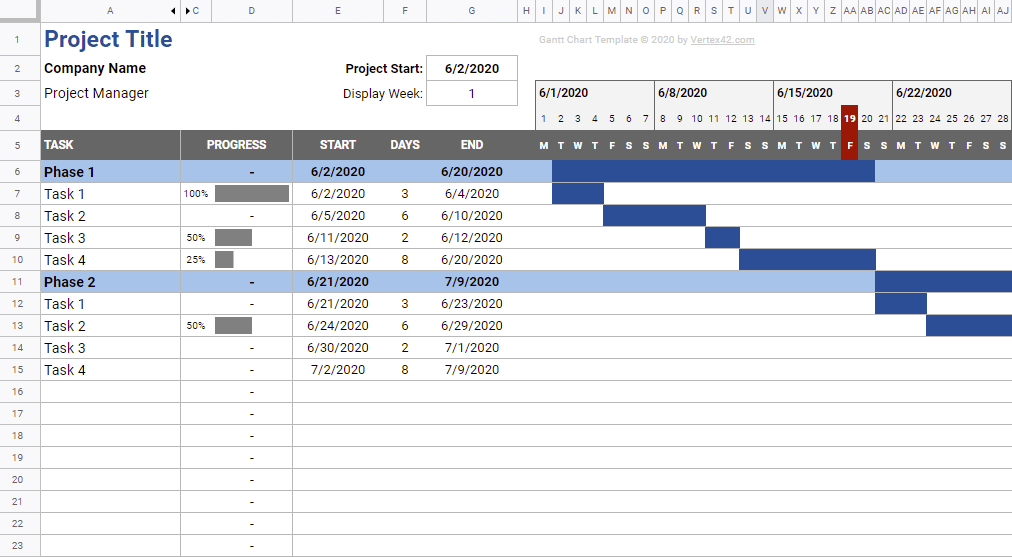
Download
⤓ Google SheetsLicense: Private Use (not for distribution or resale).
Description
This new Google Sheets version is similar to the Excel version above, but it includes a few extra features like a progress bar and formulas for calculating the start and end dates for summary tasks.

NEW: Watch Part 2 of the Google Sheets Video, showing how to use work days and skip weekends.
How to Use and Customize the Simple Gantt Chart
Although the Excel spreadsheet is compatible with multiple versions of Excel, the following instructions are based on using Excel 2016.
See the article "How to Use Conditional Formatting in Excel" to learn how to create a simple Gantt chart like this template.
Adding More Tasks
When you insert new tasks, you should first insert a blank row and then enter the task and dates. Right-click on the row number and select Insert. If you do this, the formatting will be copied automatically from the row above.
NOTE You can also copy a row and then insert the copied row, but Excel doesn't automatically merge conditional formatting rules when you do this, resulting in fractured conditional format rules. This is a known problem that Excel will hopefully fix some day.
Changing the Weeks Displayed in the Gantt Chart
You can edit the Display Week number to change the period of time displayed in the Gantt Chart. Week 1 is the week containing the Project Start Date. Incrementing the display week number has the effect of scrolling the gantt chart 1 week at a time.
HINT Add a Scroll Bar! If you are using Excel 2007/2010/2013/2016, you can add a scroll bar form control to the header and link the form control to the cell containing the Display Week number, just as in the original Gantt Chart Template.
Adding More Columns to the Gantt Chart
To increase the time span displayed in the spreadsheet, add columns to the right of the Gantt chart by copying and pasting groups of 7 columns (because the column labels on row 4 are merged cells).
How do I print my entire project schedule?
This template is set up to display 1 day per column. If your project covers a longer period of time (many months), and you don't want to add more columns to the chart, you would need to change the way the dates are displayed in the rows above the Gantt chart as well as the conditional formatting rules (possible, but not simple).
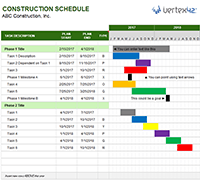
If your project spans many months and you don't need or want to display a daily view, you can try the free Construction Schedule template. If you want the ability to change the view from daily to weekly or monthly, check out Gantt Chart Template Pro.
How to Change the Color of the Bars
If you want to edit the bar color used in the Gantt chart, you will need to edit the conditional formatting rules. Go to Home > Conditional Formatting > Manage Rules and select "This Worksheet" to see and edit all the rules.
Gantt Chart Template Pro allows you to change the bar color for individual tasks by entering a color code (like "g" for green) in a separate column. The free Construction Schedule template also uses that technique.
Showing the Duration of a Task in Days
In this template, column H is hidden by default, but contains a column for calculating the task duration in Days. You can unhide column H, or you can insert your own columns to enter your own formulas.
How to Calculate the Days between Two Dates
To calculate the duration of a task based on the start and end dates, you can use the following formula:
In this template, task_end and task_start are named ranges that use relative references to refer to the values in the Start Date and End Date columns. You can use these named ranges or you can enter the formula using regular cell references such as =F8-E8+1.
How to Calculate Work Days between Two Dates
If you want to display the number of work days between two dates, not counting weekends, then you can use the NETWORKDAYS function that is built into Excel.
The NETWORKDAYS function assumes the non-work days are Saturday and Sunday. To define which days of the week are non-work days, see the Excel help on the function NETWORKDAYS.INTL.
HINT If you want to more easily define tasks using different combinations of start date, end date, calendar days, work days, and predecessors, try Gantt Chart Template Pro
Calculate an End Date by Adding Days to the Start Date
When making a more dynamic project schedule, in addition to creating task dependencies, you may want to use a formula to make the End Date always be X number of days from the Start Date. See the following examples:
1. End Date 50 days after the start date
2. End Date 5 work days (excluding Saturday and Sunday) after the start date
Create Dependent Tasks with Formulas
When setting up a project schedule, you may want to use formulas to link dependent tasks so that if you change the start date, the dependent tasks will also change.
A simple way to create a dependent task in this template is to use a formula for the start task such as =end_date+1 where "end_date" is a reference to the end date of the predecessor task (so the formula might look like =F8+1.
To start the next work day after another date, use =WORKDAY(end_date,1)
Calculate Minimum Start, Maximum End, and Overall Percent Complete
You may want to use a row to summarize the total duration and progress of the project, or you may want to summarize a set of sub-tasks. The following formulas can be used in the Start, End, and Progress columns to summarize a subset of tasks. Replace start_dates and end_dates with the appropriate range references.
1. Calculate the Minimum Start Date
2. Calculate the Maximum End Date
3. Calculate the Overall Percent Complete
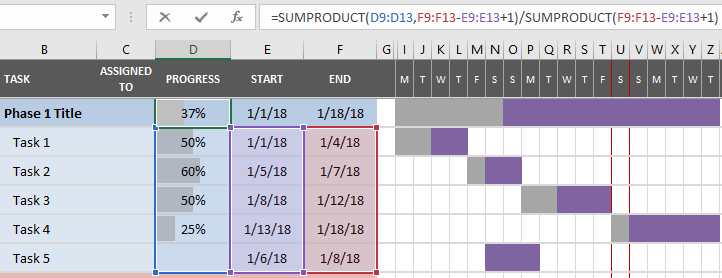
Formula for Overall Percent Complete