Gantt Chart Template for Excel
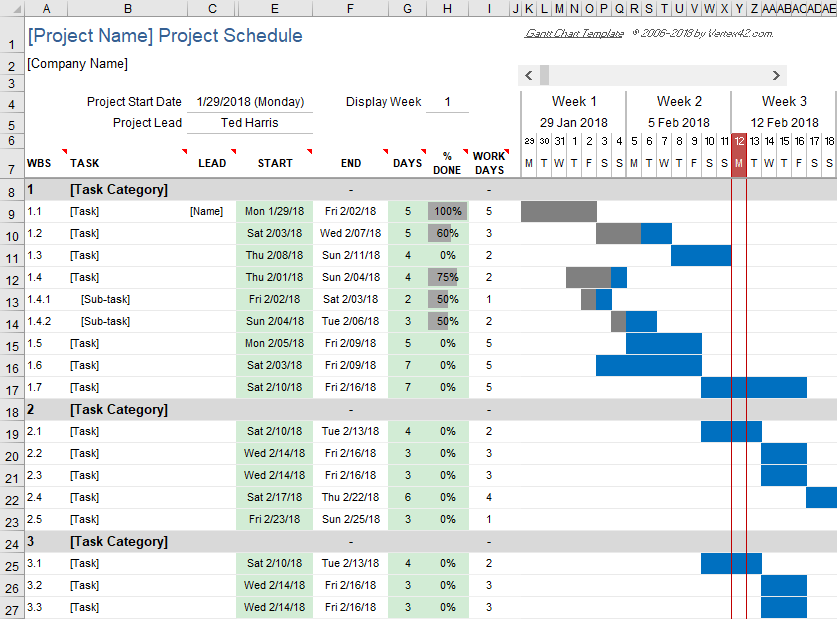
A Gantt chart is a tool for project management developed originally by Henry Gantt in the early 1900s. It is a type of bar chart that shows the start and end times for each task in a project schedule. The tasks are usually categorized using a work breakdown structure with summary tasks for the main project deliverables and sub-tasks that break the project down into a detailed and manageable task hierarchy. If you use Excel or Google Sheets, you can create this type of project schedule with almost no learning curve by downloading Vertex42's free Gantt Chart Template.
For complicated project management activities, you may need a tool such as Microsoft Project or other specialized software. But, if you want to create a simple Gantt chart quickly and easily, you only need some basic Excel skills to use this template (such as knowing how to copy and insert rows).
Excel Gantt Chart Template
"No installation, no macros - just a simple spreadsheet" - by Jon Wittwer
License: Private Use (not for distribution or resale)
This template is the original Excel Gantt Chart created by Vertex42 over a decade ago. Over 3 million downloads so far. That is a LOT of projects.
Download
Over 2.5 million downloads!
⤓ Excel (.xlsx)Go Pro!
Older Versions
Description
This template contains the core functionality needed to create a simple Gantt chart easily. Each row of the worksheet represents a separate task. All you need to do is define the start date and duration of each task.
- To add more tasks, you just copy and paste rows (or insert a row then press Ctrl+D to copy formulas down).
- To change the range of dates displayed in the chart area, just slide the scroll bar.
- To track the status of a task, edit the % Complete column. The bars in the chart show the % complete for each task.
- The vertical red line shows the current date.
- To use the automatic work breakdown structure numbering, copy the formula for the appropriate level from the bottom of the worksheet.
While planning a project, you may also want to use a yearly calendar or project budget worksheet.
- Enter Work Days, Calendar Days, or End Date
- Choose Different Colors for the Bars
- Select a Daily, Weekly, or Monthly View
- Create Task Dependencies Easily
- Exclude Holidays from Work Days
Free Gantt Chart Template
New Design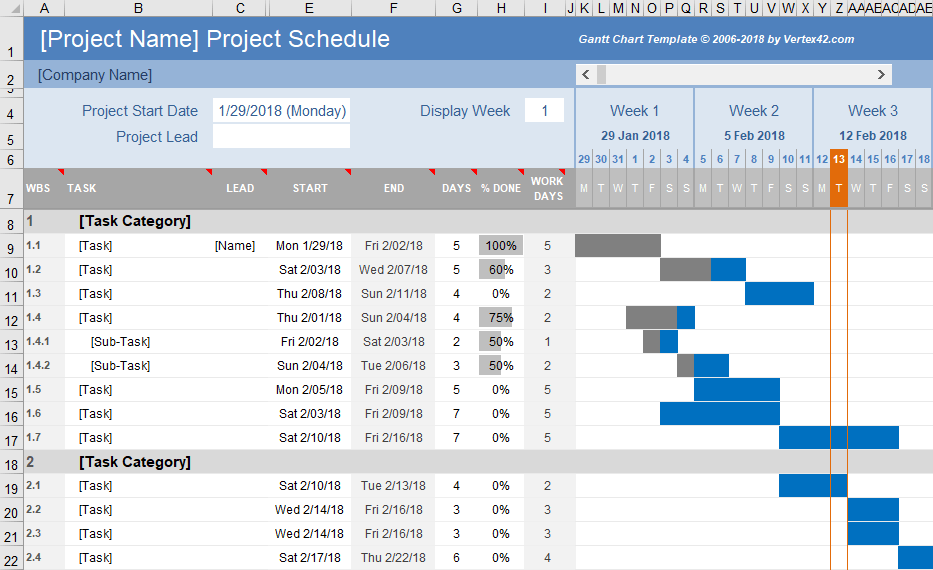
This download provides the same functionality as the original free gantt chart template above. The main difference is the formatting. The WBS, End, and Work Days columns are highlighted gray to indicate that they contain formulas.
Note: Gantt Chart Pro version 5.0 uses a design very similar to this free version.
Creating Dependent Tasks in a Gantt Chart with Excel
One of the reasons why Excel is a useful tool for creating Gantt Charts is that task dependencies can be defined by using Excel formulas. Gantt Chart Template Pro is designed to make this easier than entering your own formulas, but here are a few simple examples you can try:
1. Start a Task the Day After a Predecessor Task
where end_date is a reference to cell (e.g. D10) containing the END date of the predecessor task.
2. Start a Task on the Same Day as another task
where start_date is a reference to cell containing the START date of the other task.
3. Start a Task the next WORK day after a Predecessor task (excludes Sat & Sun)
Use the WORKDAY.INTL() function in Excel 2010+ to define a custom work week (days other than only Sat & Sun)
The problem with only using formulas is that you can't see the dependencies between tasks when you view or print the chart. Other Gantt chart software may show dependencies as lines connecting the bars in the gantt chart, but I've never found a simple way for Excel to do that (and the lines can get really messy).
The simple approach is to list the WBS number of the Predecessor in another column, like in the critical path example above. In the CPM template and in Gantt Chart Template Pro, formulas calculate the start dates based on what you enter. If you want to try doing this on your own, here is a formula to get you started:
4. Start a Task the next day after a Predecessor task listed in another column
Gantt Chart Pro uses a formula like this, but it allows up to three predecessors and it accounts for work days.
Showing Critical Tasks in a Gantt Chart
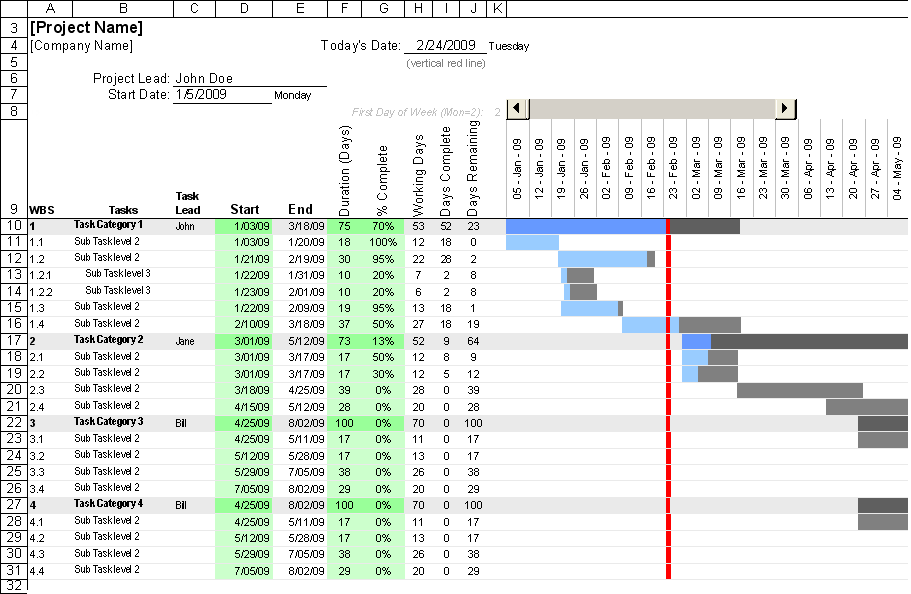
Some Gantt charts are designed to show the critical path and available slack or float time for each task. If every task must be done in sequence, every task is critical and there is no slack time (because if one task is delayed, it delays the entire project). However, if some tasks can be done in parallel and have some available slack time, then the project manager may be able to free up some resources to devote to the more critical tasks.
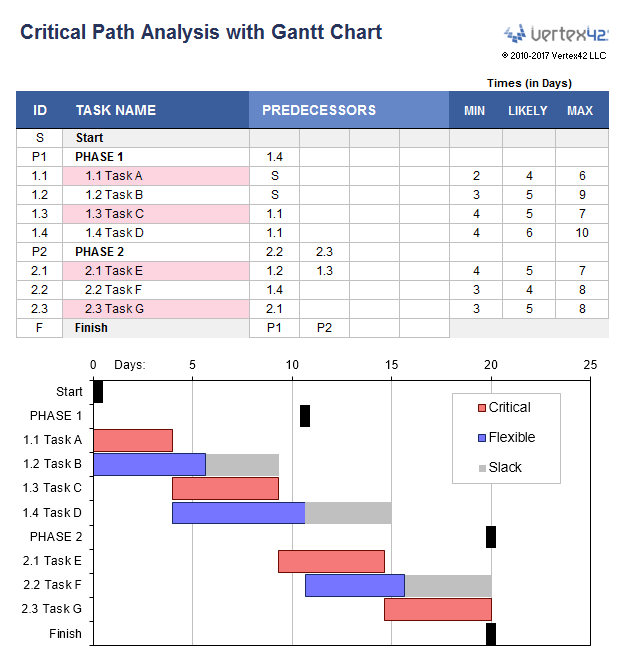
Currently, the only template I have so far that uses the Critical Path Method (CPM) algorithm to show critical tasks and available float time is the CPM Template shown in the image on the left. The Gantt chart in this example shows the critical tasks in red and the available slack time in gray.
The CPM algorithm requires a fully defined task dependency structure, meaning that every task must have a successor (another task that depends on it). A simple Gantt chart may not need to have the dependencies between tasks fully defined, which is why you will see many project schedules with tasks defined only with a start and end date.
More Free Excel Gantt Chart Templates

Commercial Gantt Chart Software
There are hundreds of software applications for creating gantt charts and project schedules. Some of the most popular are those that allow easy online collaboration such as SmartSheet.com and ProjectManager.com. And of course there's Microsoft:
- Microsoft Project - products.office.com - Although a bit pricey, this really is the ultimate software for creating gantt charts and project timelines, partly because it is widely used and you can probably find someone in your office that knows how to use it if you have questions.
Other Free Gantt Chart Spreadsheets
- Simple Project Schedule - vertex42.com - This worksheet may be useful if you want to avoid formulas and just want a way to create a stylish project timeline.
- PeltierTech.com - John Peltier explains how to create a gantt chart in Excel using stacked bar graphs.
- http://hyperthot.com/pm_excel_gantt.htm by James Chapman - This page includes a few free gantt chart downloads for Excel that also calculate spend plan. This is done by including labor costs broken down by employee and the number of hours spent on each task.
- CPM / PERT Spreadsheet - vertex42.com - This template includes a gantt chart for critical path analysis.
References
- Gantt Chart Definition and History - wikipedia.com
- Project Management Graphics (Gantt Charts) - edwardtufte.com - A detailed academic discussion about the use of gantt charts as project management tools.