Project Planner Template
Creating a well-defined project plan may be difficult, but the tools you use can be very simple. That is what I had in mind when I created this new project planner spreadsheet. Believe it or not, you don't need to enter any formulas whatsoever (you can if you want, though). To add rows, you just insert new rows and formatting is automatically updated. Because it doesn't require you to copy any formulas, it is also more basic and lacks the features of my Gantt Chart Template and the even more powerful Pro version.
Project Planner with Gantt Chart
for Excel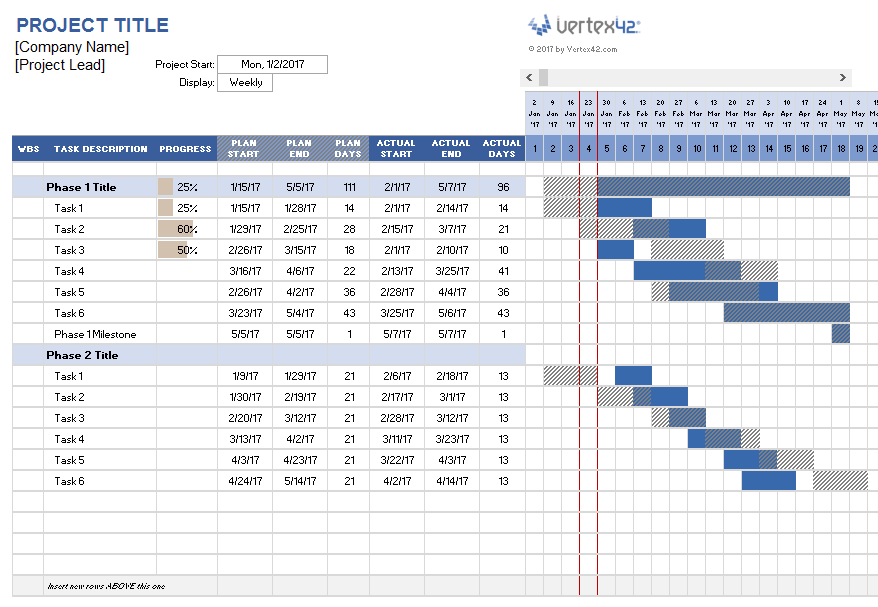
Download
⤓ Excel (.xlsx)License: Private Use
(not for distribution or resale)
"No installation, no macros - just a simple spreadsheet" - by Jon Wittwer
► How to Make a Gantt Chart in Excel
Description
This template was designed specifically for people who only want a very simple way to create a project plan and don't care about predecessors or dependencies, or work days vs. calendar days, or color coding, or automated work breakdown structure numbering. In other words, they just want to enter task descriptions and start/end dates and have a great looking gantt chart created automatically. That's what this template was designed for.
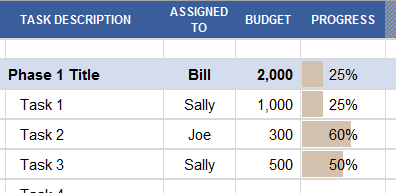
Progress, Budget, and Assigned To columns: It's easy to add columns into the project plan, but I've already included these three other columns (see the image below). When you enter the progress as a percentage, the progress bar updates automatically (See the section "How to Create an In-Cell Progress Bar" in my Conditional Formatting article).
"Days" Columns Are Not Necessary, but ...
The gantt chart in this project planner spreadsheet relies only on the Start and End date columns, so you could delete the Days columns. However, it is usually convenient to define the End date by entering the duration in Days, so you can use a formula for the End Date such as =start_date+days-1. The "-1" is included because a task is assumed to begin the morning of a day and end in the evening, such that a 1-day task is represented as having the same Start and End date.
If you want to use the Days column but enter the Start and End dates, then you can calculate the Days using a formula: =end_date-start_date+1.
Planned vs. Actual Dates
I created this project planner primarily to experiment with different ways of showing the Planned vs. Actual schedule. Ultimately what I found was that the simplest technique to understand when viewing the schedule is to use a texture fill for the Plan Schedule which allows it to overlap with the Actual Schedule. This is a technique I wrote about in the blog article "Showing Actual Dates vs. Planned Dates in a Gantt Chart."
I experimented with showing the % complete inside the bars of the gantt chart, but when showing Actual vs. Planned, it was just too confusing (too many colors and formats overlapping). That is why I included the Progress Bar inside the Progress column.
If you want the "Actual" schedule to be shown with the texture pattern instead, you could switch this simply by changing the Plan and Actual labels. Or, you can edit the conditional formatting rules to pick your own texture or color for the bars (Home > Conditional Formatting > Manage Rules). The Pro version of the gantt chart that shows Planned vs. Actual takes this a step further by allowing you to pick different colors for the bars for different tasks.