Dice Rolling Simulations in Excel
This page is just for fun and education. I'm a fan of board games, and questions always come up about the probabilities when rolling one die, two dice, etc. You can play an entire game of Settlers of Catan and never roll a 12 or a 2. How likely is that?
If you have really bad luck in a game (or really good luck), how bad or good IS it? For example, you might know that rolling a 12 with 2d6 has a probability of 2.78%, but how likely is it that you will NEVER roll a 12 within 100 rolls of the dice?
These are some of the questions I plan to help answer on this page, and might as well make it fun, with some dice race simulations!
1d6 Dice Rolling Simulation
in Excel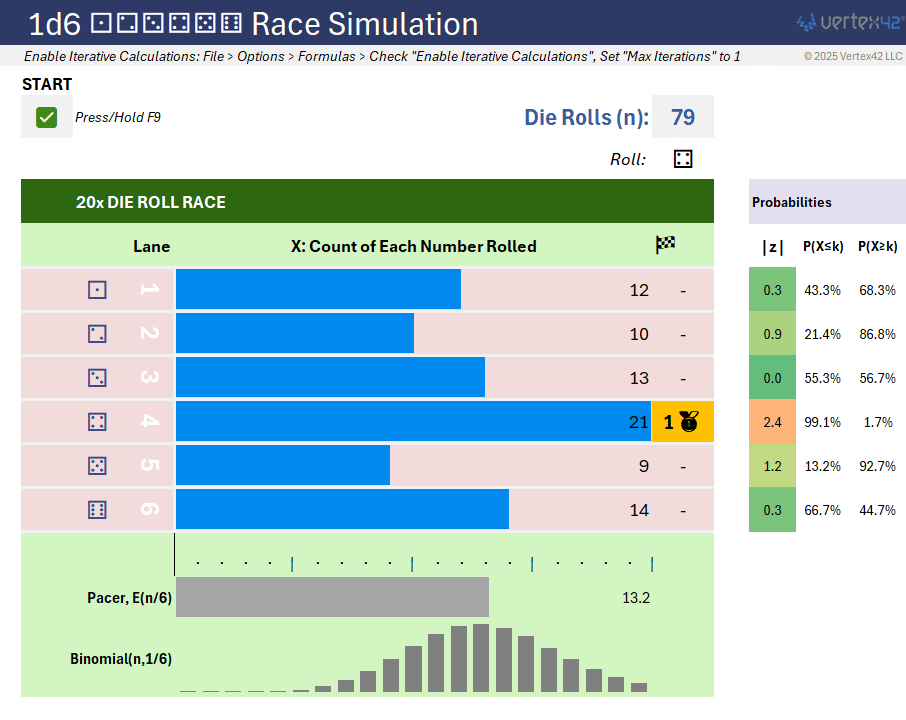
Download
⤓ Excel (.xlsx)License: Private Use (not for distribution or resale)
Description
This model simulates repeated rolls of a six-sided die (1d6) and tracks how many times each number has been rolled. The race ends when one of the numbers reaches 20 occurrences, making it the winner of the 20x race. The spreadsheet updates dynamically, allowing you to observe probability, variance, and distribution behavior in real-time.
Excel-Powered Features and Visuals
- Pacer Bar: The gray pacer bar beneath the track represents the theoretical average number of times a specific number should appear after n rolls. It gives you a quick visual benchmark for judging each lane's performance.
- Binomial Distribution Chart: Directly under the pacer bar, a sparkline-based binomial chart shows the expected spread of results for n trials with probability 1/6. It shows visually how likely different roll counts are. A count that falls within the bulk of the bell-shaped curve represents a fairly common variation.
- Z-Score & Probabilities: To the right of the track under Probabilities is the z-score. This is the measure of how far the result deviates from the expected count in terms of standard deviations. The conditional color formatting highlights extreme results in red (rare events) and typical results in green.
2d6 Dice Rolling Simulation
in Excel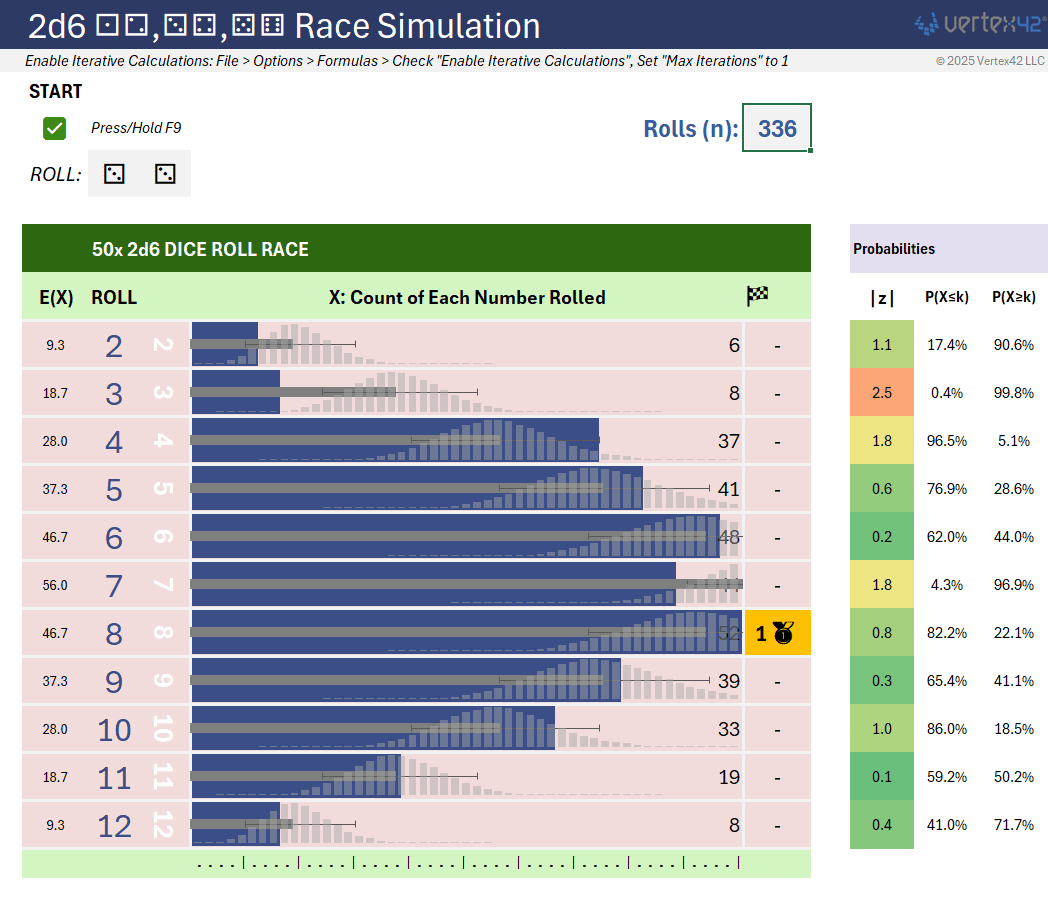
Download
⤓ Excel (.xlsx)License: Private Use (not for distribution or resale)
Description
This model simulates repeated rolls of TWO six-sided dice (2d6) and shows how many times each number is rolled. You might think the winner of this race should always be #7, but probability says "not necessarily."
The probability of each roll is different for TWO dice, so the Binomial distribution for each roll is shown superimposed on the current count. This lets you see how far the current count is deviating from the expected count.
If you run the 2d6 Race Simulation out to a total of 70 rolls, that is like simulating a game of Settlers of Catan! Pause the video at n=70 in the following video.
Animation Using Circular References
These simulations use circular references with Maximum Iterations set to 1, so that each time you press F9, the dice are rerolled. Holding F9 makes the simulation go as fast as Excel is capable of running the calculations and displaying the results.
To create an animation, you first need to Enable Iterative Calculations with Max Iterations = 1 by going to File > Options > Formulas. Unhide the hidden rows, check the Start box, and press/hold F9 to force recalculation of the spreadsheet (which iterates by 1 each press).
The Math of Rolling Dice
Rolling 1d6, ⚅
The probability of rolling any one number with one six-sided die (1d6) is p=1/6 or about 16.7%.
The binomial distribution describes the probability of rolling a specific number exactly k times within N rolls. You can use the BINOM.DIST function in Excel.
PMF (Proability Mass Function)     =BINOM.DIST(k, N, p, FALSE)
CDF (Cumulative Density Function)  =BINOM.DIST(k, N, p, TRUE)
Rolling 2d6, ⚄⚅
There are 36 possible combinations when rolling 2 dice, with the sum being a value between 2 and 12. The probabilities for rolling each number are:
| Roll (Sum) | Probability | Dice Combinations |
|---|---|---|
| 2 | 1/36, 2.78% | ⚀⚀ |
| 3 | 2/36, 5.56% | ⚀⚁, ⚁⚀ |
| 4 | 3/36, 8.33% | ⚀⚂, ⚁⚁, ⚂⚀ |
| 5 | 4/36, 11.1% | ⚀⚃, ⚁⚂, ⚂⚁, ⚃⚀ |
| 6 | 5/36, 13.9% | ⚀⚄, ⚁⚃, ⚂⚂, ⚃⚁, ⚄⚀ |
| 7 | 6/36, 16.7% | ⚀⚅, ⚁⚄, ⚂⚃, ⚃⚂, ⚄⚁, ⚅⚀ |
| 8 | 5/36, 13.9% | ⚁⚅, ⚂⚄, ⚃⚃, ⚄⚂, ⚅⚁ |
| 9 | 4/36, 11.1% | ⚂⚅, ⚃⚄, ⚄⚃, ⚅⚂ |
| 10 | 3/36, 8.33% | ⚃⚅, ⚄⚄, ⚅⚃ |
| 11 | 2/36, 5.56% | ⚄⚅, ⚅⚄ |
| 12 | 1/36, 2.78% | ⚅⚅ |
k Times out of N rolls
The binomial distribution is still used for describing the probability of rolling a specific number exactly k times within N rolls, but the value for p is different for each number (although p is the same for 2 and 12, 3 and 11, etc.).
Let's go back to Settlers of Catan. A typical game might be about 70 rolls of the dice. So, what is the probability of rolling ZERO 2s within 70 Rolls?
=BINOM.DIST(0, 70, 1/36, FALSE)
=0.139
So, that is about a 14% chance of not rolling any 2s within a game of Setters of Catan! That isn't terribly rare, after all.
P(X≤k) and P(X≥k)
With 2d6, what is the probability of rolling a 12 at least 4 times, P(X≥4)? To answer that question we calculate 1-P(X≤3) using the CDF like this:
P(X≤4) =BINOM.DIST(4, 70, 1/36, TRUE)
P(X≥4) =1-BINOM.DIST(4-1, 70, 1/36, TRUE)
=0.1304  (or 13%)
Expected Count
With 2d6, what is the expected number of times you would roll a particular number out of 70 rolls? The answer is p*70. For a #12, that is (1/36)*70 = 1.94. For a #7, that is (6/36)*70 = 11.67
References and Resources
- Binomial Distribution - Wikipedia