Strategic Planning Templates
Plan, analyze and prioritize your initiatives using Excel
Strategic planning is about deciding where you're going and how you'll get there. Whether you're running a business, leading a team, or planning a new project, analyzing your plan and tasks can help you focus on what matters and avoid wasted effort.
These Excel templates keep things simple and usable. You can analyze risks, prioritize ideas and tasks, set measurable goals, map out initiatives, and track progress. Each template is customizable, making it easy to adapt the framework to your organization.
High-Level Business Planning

Use a SWOT Analysis to evaluate the Strengths, Weaknesses, Opportunities, and Threats for your business, product, or service.
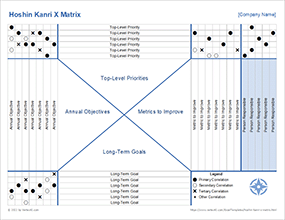
Use this template for high-level business planning. Correlate objectives, priorities, goals and metrics along with the people responsible.
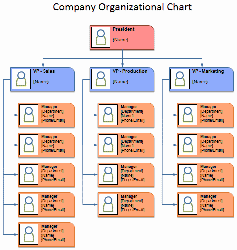
Many different types of organizational charts all in one file, including functional, divisional, horizontal, and matrix org charts. For businesses, corporations, schools, and non-profits.

Download a free RACI Matrix Template to assign roles to project tasks as Responsible, Accountable, Consulted, Informed.
Risk Assessment Tools
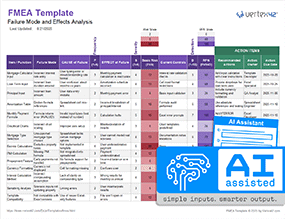
Use this AI-Assisted template to help you perform a Failure Mode and Effects Analysis for a product, process, or system.

Create and customize a risk assessment matrix. List risks and prioritize based on likelihood and impact.
Project Management
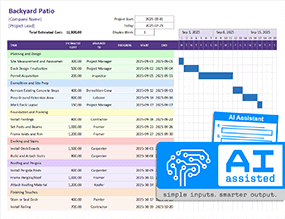
Use AI to help you populate a project schedule with a sample set of tasks and costs.

Manage tasks collaboratively using an agile project management methodology.
More Project Management Templates ▶
Rank and Prioritize Tasks
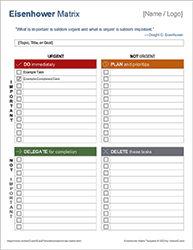
Use an Eisenhower Matrix to prioritize your tasks based on urgency and importance.

Assign tasks into categories based on Value and Difficulty using a new J.A.M. rating.
Timeline-Based Roadmaps

Create a project timeline in Excel using a stacked bar graph with milestones and different colors for different phases or categories.
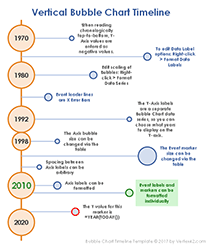
Create a vertical timeline in Excel using a Bubble Chart