PICK Chart for Lean Six Sigma
This Page (contents):
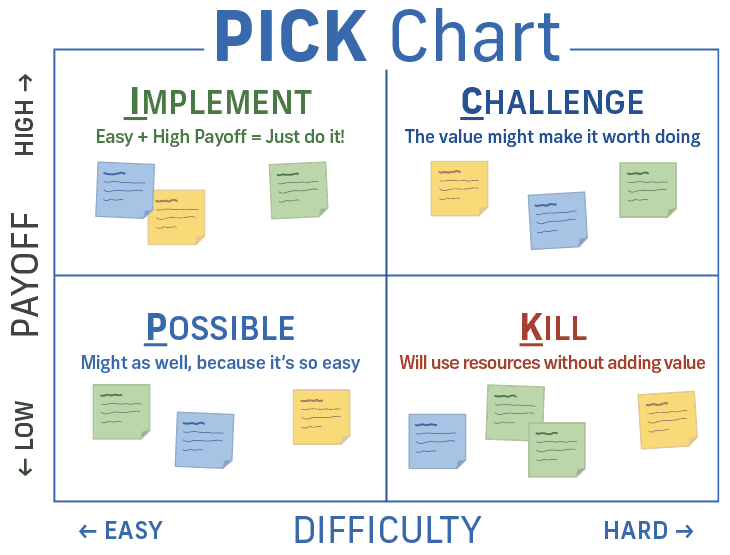
A PICK Chart is a very effective Lean Six Sigma tool used to categorize process improvement ideas after a brainstorm session. The purpose is to help identify and prioritize the most useful ideas. The 2x2 grid is normally drawn on a white board or large flip-chart. Ideas that were previously written on sticky notes during the brainstorm session are then placed on the grid based on the payoff and difficulty level. The "PICK" acronym comes from the labels for each of the quadrants of the grid: Possible (easy, low payoff), Implement (easy, high payoff), Challenge (hard, high payoff), and Kill (hard, low payoff).
Why is a PICK Chart useful?
- Provides a visual approach to decision-making
- Makes it easier to prioritize tasks
- Encourages team collaboration
- Helps to understand feasibility and impact
- Facilitates continuous improvement
Action Item List with PICK Ranking
for Excel
Download
⤓ Excel (.xlsx)⤓ Google Sheets
License: Private Use (not for distribution or resale)
Description
This is an Action Item List template with columns for entering the Value and Difficulty. The PICK column will update automatically based on your choices.
PICK Chart Template
for Excel and Google Sheets
Description
This PICK chart spreadsheet is used to create an electronic record of how the process improvement ideas are categorized. When recording the ideas in the spreadsheet, list them below the chart in the respective categories. In this spreadsheet, the PICK Chart is used for reference only.
The action item list template below provides an easier way to record and track the items from your PICK chart exercise. You may also want to try the other spreadsheets on my Action Item Template page.
Using a PICK Chart
When using a PICK chart, the team members should be reminded that the purpose is to help identify the most useful ideas, especially those that can be accomplished immediately with little difficulty (called "Just-Do-Its").
An electronic record is created either after the meeting or during the meeting by someone assigned to document the proceedings on their laptop. For online meetings, you can collaborate using one of the Google Sheets templates.
When drawing the PICK Chart, draw the 2x2 grid and write the labels on the axes (Low to High Payoff and Easy to Hard Difficulty). Write "Just Do It" in the Implement quadrant, but keep the other quadrants blank. Try to avoid writing the names of the other quadrants because people may have a hard time categorizing something as hard and low payoff if they see the "Kill" label on the chart.
Keep it simple. If the team decides that it is important for an idea to be ranked as 'extremely hard' or 'very high payoff', you can make a note of that or place it along a quadrant accordingly, but try to encourage team members to think of the chart as only 4 choices. Ranking the ideas along a continuous scale is a waste of time since the relative ranking is not going to be recorded and analytical people tend to argue too much about where exactly along the scale an item belongs.
Don't put an idea on a line between two quadrants. That just encourages the team to avoid making decisions. Discussion is good, but if it is taking too long, encourage the team to just pick a category and make a note to return to the discussion later if there is time.
Regulary update and revisit your PICK Chart. As the project progresses, consider using your chart as part of a feedback loop. Priorities may change, new items may need to be added, and both new and previous information can be used to keep improving the process.
JAM Chart Template
for Excel and Google Sheets
Download
⤓ Excel (.xlsx)⤓ Google Sheets
License: Private Use (not for distribution or resale)
Description
This chart features a rating system developed by Vertex42 that is similar to PICK but includes a grid of 9 squares rather than 4. JAM is an acronym for Just-do-it, Abandon, Maybe. See the Action Items Template page for a very easy-to-use spreadsheet that implements this ranking scale.