Gantt Chart Template PRO
Gantt Chart Template Pro is a spreadsheet designed for Excel and Google Sheets that makes creating project schedules easy, without using any VBA or macros. It includes many features that make it more powerful than our free gantt chart or project schedule template.
Current Version 5.0: Compatible with Excel 2010 or later, including Microsoft 365 and Excel Online. Purchase includes a version for Google Sheets.
Use Work Days to Define Task Durations
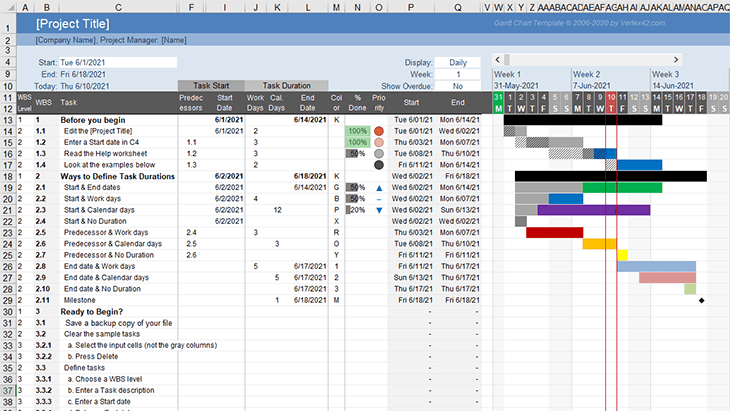
Gantt Chart Pro provides multiple options for defining Task Durations, including entering Work Days, Calendar Days or the End Date. Version 5.0 includes improved logic and options for calculating the task Start and End based on what you enter in the Task Start and Task Duration columns.
Customize Holidays
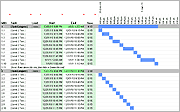
You can customize the dates listed in the Holidays worksheet. They are treated as non-work days and are highlighted green in the Gantt Chart (like May 31 above).
Customize Weekend Days
Choose which days of the week to define as the weekend in the Help & Settings worksheet. The default weekend is Saturday and Sunday. Weekends are highlighted in the Daily view of the Gantt Chart.
Choose Different Colors for Tasks
Change the color of the bars in the chart by selecting from a predefined set of of colors. The standard colors are B=Blue, G=Green, P=Purple, K=Black, X=Gray, R=Red, O=Orange and Y=Yellow. Color codes 1-6 refer to the 6 accent theme colors in Excel.
Change the Display to Daily, Weekly, Monthly
The most commonly requested views for the gantt chart are Daily and Weekly, but we've also included Monthly and Quarterly options. Simply select the Display option from the drop-down at the top of the worksheet.
A scroll bar is not available in Excel Online or Google Sheets, but you can change the display by modifying the display Week number.
Show Sequential or ISO Week Numbers
If you want to show ISO week numbers (1-53) instead of sequential numbers in the column labels, you can choose that option in the Help & Settings worksheet. Sequential week numbers are relative to the Project Start date, while ISO week numbers are based on the week of the year (1-53).
Automatic WBS Numbering
The spreadsheet uses formulas in the WBS column to automatically create the outline-style Work Breakdown Structure numbers for each task.
You can insert and delete tasks without having to manually change task IDs. All you need to do is enter the task level (1,2,3,4) in the WBS Level column.
Inserting Rows
One of the most important things to remember when using Gantt Chart Pro is to always copy an entire row down after inserting new rows so that all of the formulas used in the calculated columns and gantt chart area are copied into the newly inserted rows.
Automatic Indenting
Gantt Chart Pro for Excel uses conditional formatting rules and custom number formatting to automatically indent the task description based on the WBS Level. This is not yet possible in Google Sheets.
Excel Tip: The video shows how to fill multiple cells with the same value: Select the cells, type the value, then press Ctrl+Enter.
Create Dependencies Using Predecessors
The most common task dependency, known as the Finish-to-Start (FS) dependency, is a task that starts the next work day after the predecessor task ends. We've made this very easy to do. Simply use a formula in the Predecessor column to reference the WBS of the predecessor task.
Multiple Predecessors
Some tasks depend on the completion of more than one other task. Gantt Chart Pro lets you define up to 3 predecessors per task. Unhide the extra predecessor columns if you want to use them (see the video above).
Specify Lead or Lag with Predecessors
Update 12/1/2021: There is now a new Lead/Lag column hidden by default right after the Predecessors columns. Using this optional column will make the task start X work days after (Lead) or before (Lag) the end date of the predecessor. Enter a positive value for Lead or a negative value for Lag. This column only works in combination with the Predecessors column(s).
Other Dependency Types: SS, FF, SF
Other dependency types can be created using spreadsheet formulas to set the Start Date or End Date (input columns I or L in the above video) equal to the Start or End date of another task (referencing column P or Q for that task). These may be very simple formulas or may get as complex as your spreadsheet skills allow.
For example, to make a Start-to-Start (SS) dependency, edit cell I16 by entering =P15 to set the start date in cell I16 equal to the date in cell P15. The process is similar for a Finish-to-Finish (FF) dependency where you set the end date of one task equal to the end date of another task. A Start-to-Finish (SF) dependency may involve a scenario where you need to start task B a number of days before task A ends, such as the formula =Q15-3 (where Q is the End date column and you are subtracting 3 days).
Track Your Progress
The video below demonstrates some of the features related to tracking your project's progress, including the % Done column, the new Priority column and the new Show Overdue option.
Purchase
Tried and Tested - With over 30,000 users and numerous updates and improvements since 2006, Gantt Chart Pro is a tried and tested solution. Try it!
Unlocked - The pro version does not use password protected sheets, so you have access to all Excel features and can customize as needed (within the limitations of the license agreement).
Free Updates - We will never ask you to purchase an upgraded version. You can simply return to the download page to get the latest version and the bonus files.
Affordable for the Entire Team! When you buy this template, you are buying it for your entire team, not just a single computer or user.
Compatibility: Version 5.0 was designed to work in Excel 2010 or later and can be edited in Excel Online (without the scroll bar). The Excel file is not fully compatible with Google Sheets, but a separate template designed for Google Sheets is available with your same purchase.
$35.00
Buy Now via ClickBank.netDigital Download
Required: Microsoft Excel 2010 or later, English language settings
A version for Google Sheets is included with this purchase.
License: Private Use
Author: Jon Wittwer
Support:
General Support
FAQ - Purchasing
FAQ - Technical Support
See the Help Section below for more details and frequently asked questions.
"I just wanted to send you a quick thank you for the superb quality website and Gantt chart. Your product is allowing me to focus on management of the project, rather than Excel formulas to build a Gantt chart manually. Also appreciated are the short and accurate videos on your site. In just minutes I find what I need and can get back to being productive."
"This basic timeline functionality is exactly what I was looking for, and I couldn't find anything else like it out there. I just need a way to visualize all of my concurrent projects on one sheet. This is an economical solution that doesn't overwhelm with more project-management features than I need."
The following bonus files are included with the purchase of Gantt Chart Pro. Each is a separate file, and there is no automated means of transferring information from one file to the other.
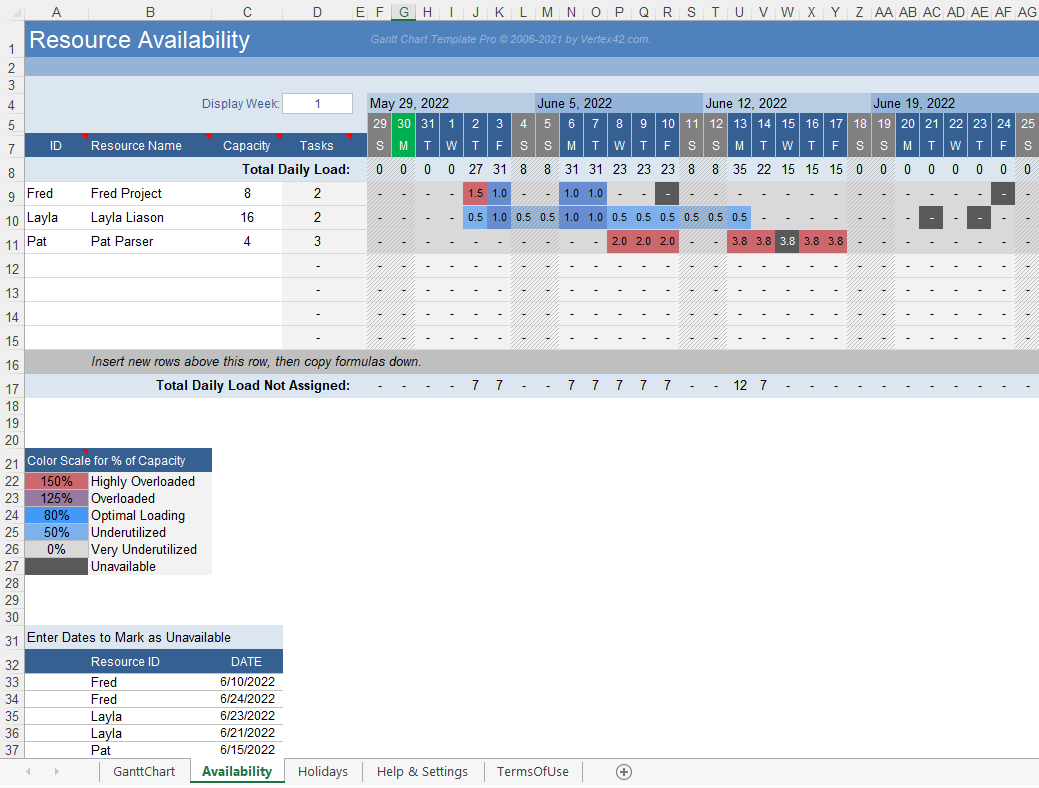
Bonus: Advanced Version with Resource Availability
A beta for an advanced and admittedly more complex version of Gantt Chart Pro can be downloaded that includes resource loading and links to a Resource Availability worksheet that can help manage employees assigned to specific tasks (one resource per task). For Excel 2019 or later. Feedback welcome.
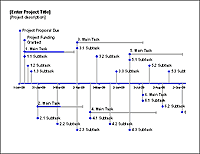
Bonus: Excel Timeline Template
Create timeline charts using our Timeline Template ($19.95 when purchased separately).
Bonus: Time-Based Gantt Chart
Use this template to define a process based on minutes and/or hours, using a full 24-hour schedule. Start and End times uses DateTime values. Choose the display interval in minutes (15, 30, 60, etc). Durations are entered as times instead of days. Does not handle weekends or holidays.
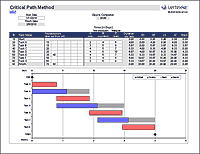
Bonus: Critical Path Method Spreadsheet
Analyze your project schedule using the Pro version of our critical path method (CPM) spreadsheet (Excel 2010 or later, $14.95 when purchased separately).
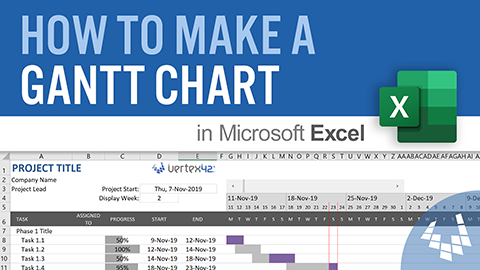
Bonus: Files from the Video Tutorial Series "How to Make a Gantt Chart in Excel"
Using Gantt Chart Pro
The Help worksheet within the spreadsheet contains answers to most common questions about how to use the Gantt chart. You are welcome to contact me if you have other questions, but please take a look through the Help worksheet and the Gantt Chart technical support page first.
Getting Started
If you are just getting started, make sure to watch all the videos above. These have been updated for version 5.0. Videos for older versions are available near the bottom of this page.
REMEMBER: You have 60 days to request a refund if you find that Gantt Chart Pro isn't for you.
Mark Milestones with a Diamond
(New in Version 5.0) When you select or enter "M" in the color column, the chart will show a diamond symbol instead of a bar in the Gantt Chart. A diamond is commonly used for milestones. You only need to define the End Date or the Start Date when defining a milestone.
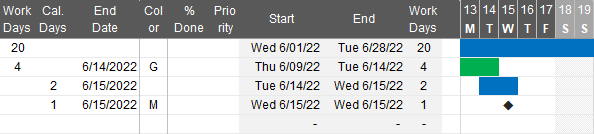
Showing Milestones as a Diamond in the Gantt Chart
Use Freeze Panes to Aid in Scrolling
Freeze Panes is a built-in feature for both Excel and Google Sheets, but we've designed the layout of the gantt chart specifically to make Freeze Panes useful. Freeze Panes allows you to keep the top rows and the left columns locked in place as you scroll.
Calculate Start and End Dates for Summary Tasks
In the Start Date input column for a summary task, enter the formula =MIN(startdates) where startdates is a reference to the range of start dates for sub tasks. In the End Date input column, enter the formula =MAX(enddates) where enddates is a reference to the range of end dates for sub tasks.
The MINIFS and MAXIFS functions available in the most recent version of Excel (and Google Sheets) make it possible to calculate the Start and End dates for summary tasks without having to select specific ranges. See the Help & Settings worksheet for instructions.
Show Planned vs. Actual
Planned vs. Actual in Version 4.0
This is a less-used feature, so the Planned Start and Planned End columns are hidden by default. Unhide all the hidden columns in the spreadsheet to see everything. You can then hide the columns you don't need to see or use.
After you create your project schedule, you can copy the dates from the calculated Start and End columns and then use Paste Special > Values to paste these dates into the Planned Start and Planned End columns.
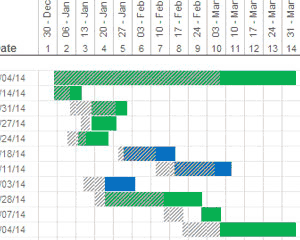
As you update your actual schedule, you can turn on the Display Plan option to show the planned schedule as cross-hatched cells in the Gantt chart.
See the blog article "Actual Dates vs. Planned Dates in a Gantt Chart" to see how this feature was implemented in older versions.
Grouping Tasks
You can use Excel's grouping and outlining feature to hide or show groups of tasks by clicking on a +/- button. See my article Grouping and Outlining in Excel to learn how to expand and collapse groups of rows.
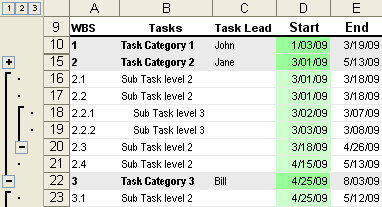
Grouping and WBS numbering in the gantt chart.
Assign Budget to Each Task
We have other project budget templates for creating more detailed budget and cost estimates, but you can also use the hidden budget column if you want to add budget information within Gantt Chart Pro.
Use formulas like =SUM(values) or =SUBTOTAL(9,values) in summary tasks rows to calculate the sum of the budget values for sub tasks. Using SUBTOTAL will ignore other subtotals in the values range, making it useful for calculating a grand total.
Expand the Number of Columns in the Chart
To see more of your project schedule in a single view, you can either use the Weekly or Monthly views or you can expand the number of columns used in the chart area. If you need to do that you can unhide the hidden columns to the right of the Gantt chart. If you still need more, you can add more columns by copying/pasting using the drag handle. See the following video (this is not Gantt Chart Pro, but the same technique applies).
Videos for Older Versions 4 or Earlier
Below are some videos showing older versions of Gantt Chart Template Pro. These are included here for the people still using the older versions. To learn what was new in Version 4.0, see the article "Gantt charts made easy" and "Creating a Gantt Chart with Excel is Getting Even Easier."
FAQ
We also use our blog to provide answers to common questions and other technical support for Gantt Chart Template Pro. The following are quick links to areas on our "Technical Support" page.
- The spreadsheet is being slow. How do I speed it up?
- How do I print my entire project?
- Can I increase the number of columns displayed in the Gantt Chart if I'm using Excel 2007?
- Can I enter and display dates in UK format (dd/mm/yy)?
- Can I import tasks into Microsoft Project?
- Green cells are inputs, but why do some contain formulas?
- How do I use the Percent (%) Complete?
- Why is the red line marking Today's Date not showing up?