Monte Carlo Simulation Template
I was working on a probabilistic financial model recently, so I whipped up a simple VBA macro to run the iteration and save the results. What came out of that was an idea for this template. It is not intended to be an end-all be-all Monte Carlo Simulation add-in. In fact, it has quite a few limitations, but it can be very educational if you are interested in seeing how it works in Excel.
If you are new to Monte Carlo Simulation, you may want to refer to an article I wrote back in 2004 that provides a very basic overview and demonstrates the process with an example in Excel.
► Monte Carlo Simulation: A Practical Guide
For very simple models, the approach used in the above article can work well. But, the new template below makes the setup a lot easier and it lets you run a simulation using a model that is defined in a separate worksheet.
The template below is not free, but that is only because an extensive amount of work and research went into the creation of this tool, so I don't want to just give it away.
Monte Carlo Simulation Template
for Excel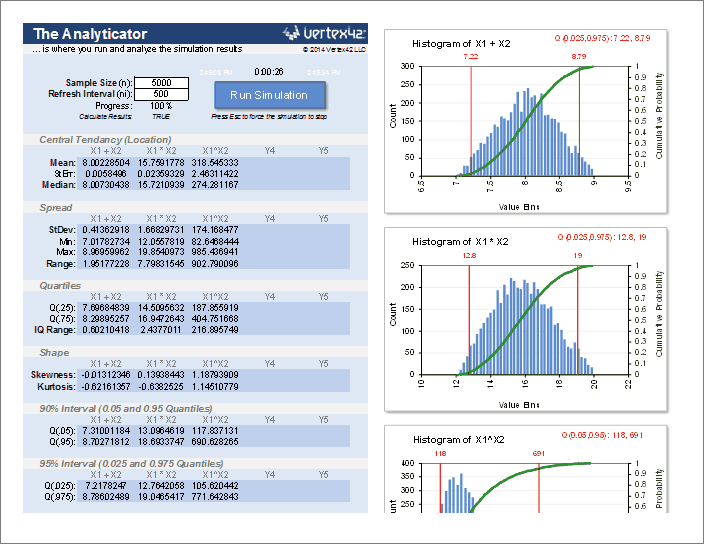
via ClickBank.net
Template Details
Version 1.2.0
No installation required.
Contains a VBA macro for running the simulation.
License: Private Use(not for distribution or resale)
Description
This Monte Carlo Simulation template is basically just an iterator that helps you generate random inputs, run your model for those set of inputs, and do some basic analysis for up to 5 outputs.
This spreadsheet does not help you create your model. For example, if you are doing a break-even analysis, you must already have the break-even analysis model created. It can be in a separate workbook.
Make sure to read everything below BEFORE buying this! Please don't buy it if you are expecting too much from it. I'm always happy to give refunds if you decide to try it and find that it isn't what you were expecting.
1. The Randomator
This worksheet provides a convenient place to define your random inputs. It generates pseudo-random values using some of the common built-in Excel formulas like RAND(), RANDBETWEEN(), NORM.INV(), LOGNORM.INV(), BETA.INV(), and BINOM.INV().
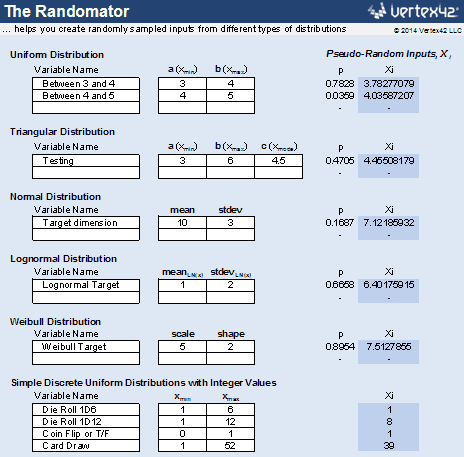
All you need to do is define the input variables and then link the inputs in your model to the cells containing the random Xi values. Add more variables by inserting new lines and copying formulas down.
The worksheet also lets you define your own custom discrete distribution by entering probabilities. For example: 30% chance of a loss, 50% chance of a win, and 20% chance of a tie.
2. The Iterator
Not pictured, because it's just VBA code.
The Iterator is a very simple macro that (a) recalculates Excel - the same thing that happens when you press F9 in Excel, (b) stores the inputs and outputs in the spreadsheet, and (c) repeats steps a and b a bunch of times.
I did not lock the VBA code. You are welcome to take a look and add your own VBA joy.
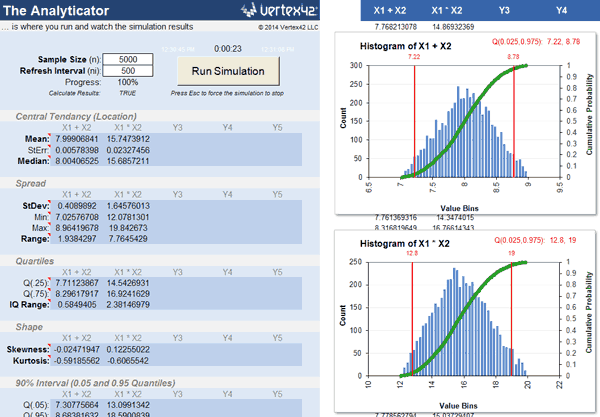
3. The Analyticator
This spreadsheet is set up with histograms and summary statistics to analyze up to 5 different columns of output data - the type of data generated by a Monte Carlo simulation.
This is where you press the big Run Simulation button. You can define the number of iterations and the refresh interval here as well.
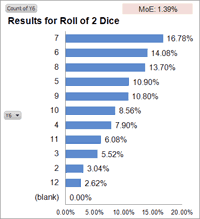
In addition to analyzing 5 numerical outputs, you can analyze one output (Y6) that may have either discrete numeric results or text-based results. The discrete analysis involves using a pivot table and pivot chart to show the proportion of responses (as percentages), as in the case shown below for the roll of two 6-sided dice.
4. The Interface
This is a spreadsheet I added to make it simpler to define the set of inputs and outputs and to interface the Monte Carlo Simulation template with a model that might be in a separate worksheet or workbook.
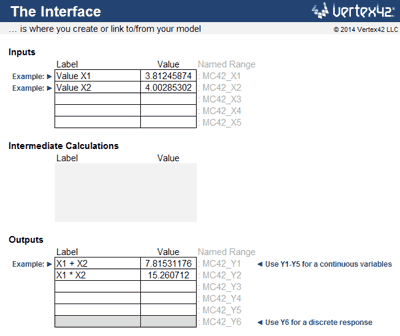
Example: Let's say you are doing a break-even analysis to determine the break even price, and your break-even analysis is located in a separate Excel workbook. The number of units sold is an uncertain input located in cell A2 of your workbook, and the break-even price is the output located in cell A42.
- In the Interface worksheet, clear the example Label and Value cells in the Inputs and Outputs tables and delete the "Example:>" text.
- Enter "Units Sold" for the Label in the first row of the Inputs table.
- In the Value cell, enter a formula such as =Randomator!J6 to link to a random Xi value in the Randomator worksheet. You will also want to adjust the distribution parameters for your input in the Randomator worksheet.
- In your break-even analysis workbook, link cell A2 to the corresponding "Value" cell in the Interface worksheet. The formula in A2 will look like this:
You can create that formula by pressing "=" in cell A2 and then using your mouse to select the Value cell in the Interface worksheet.
Now you just need to define the output in the interface worksheet.
- Enter "Break Even Price" for the Label in the first row of the Outputs table.
- Create a cell reference for the Value by linking to cell A42 in your workbook.
The formula for the Value in the Outputs table might look like this:
With the inputs and outputs linked up, you can now hop to the Analyticator worksheet and run the simulation.
Demo Videos
Example #1: Breakeven Analysis
Note: In this example, if you wanted to limit the Selling Price to the integer values $11, $12 and $13, you could use the formula =RANDBETWEEN(11,13) as the Value in the Interface worksheet. It isn't necessary to use the Randomator worksheet if you want to define the formula for the random variable yourself.
Example #2: Project Schedule
Note: In this example, the output is a date. This requires changing the format of some of the results so that they show dates rather than the numeric date values.
In the Analyticator worksheet ...
- Update the Significant Digits in cell B50 to 5, so the quartile labels on the chart are more accurate.
- Format cells B51 and B52 as dates, so the quartile labels on the chart make sense. (And B12 and B14 if you want to see the mean/median as dates)
- Format the horizontal axis labels as dates, so the chart distribution makes sense.
A date is technically a discrete output. It's important to be careful about using summary statistics designed for continuous variables, but the histogram of the results is the main thing we were interested in. Note that the gaps in the histogram are weekends.
Limitations
Here are the reasons why most people will probably decide to use one of the more advanced Monte Carlo Simulation add-ins:
- Only analyzes up to 5 output variables and 1 discrete output at a time.
- Not the most efficient simulation. How many iterations it can handle will depend on the complexity of your model and your patience. For a very simple model, it takes about 45 seconds to run 10,000 iterations.
- It's complicated. Monte Carlo Simulation is itself a highly technical topic. On top of that, you need to know how to use Excel well enough to create models, edit formulas, diagnose errors, etc.
- Limited choice of input distributions. The Randomator only includes a few of the most common distributions: Uniform, Triangular, Normal, Lognormal, Weibull, Beta, Bernoulli, Binomial, and a few examples that use RANDBETWEEN().
- Very limited correlated input options. Although I'm proud of the fact that the Randomator includes Gaussian, Clayton, and Frank copulas for generating bivariate distributions, it's up to you to know how to use them.
- Not a comprehensive risk analysis tool. It does not have any of the bells and whistles of high-end simulation and risk analysis tools like @Risk or Risk Solver.
- Very limited technical support. I can help you if you have problems downloading the spreadsheet, or need a refund, but everything else is up to you.
Release Notes
Version 1.2.0 - Added Clayton and Frank copulas for correlated inputs.
Version 1.1.0 - Added correlation analysis to the Analyticator worksheet. Added a method for generating two correlated inputs using the Gaussian copula.
Version 1.0.1 - Added the BETA distribution, Student's t-distribution, and a custom discrete distribution to the Randomator worksheet.
References
- Wittwer, J.W., "Monte Carlo Simulation in Excel: A Practical Guide", June 1, 2004, https://www.vertex42.com/ExcelArticles/mc/
