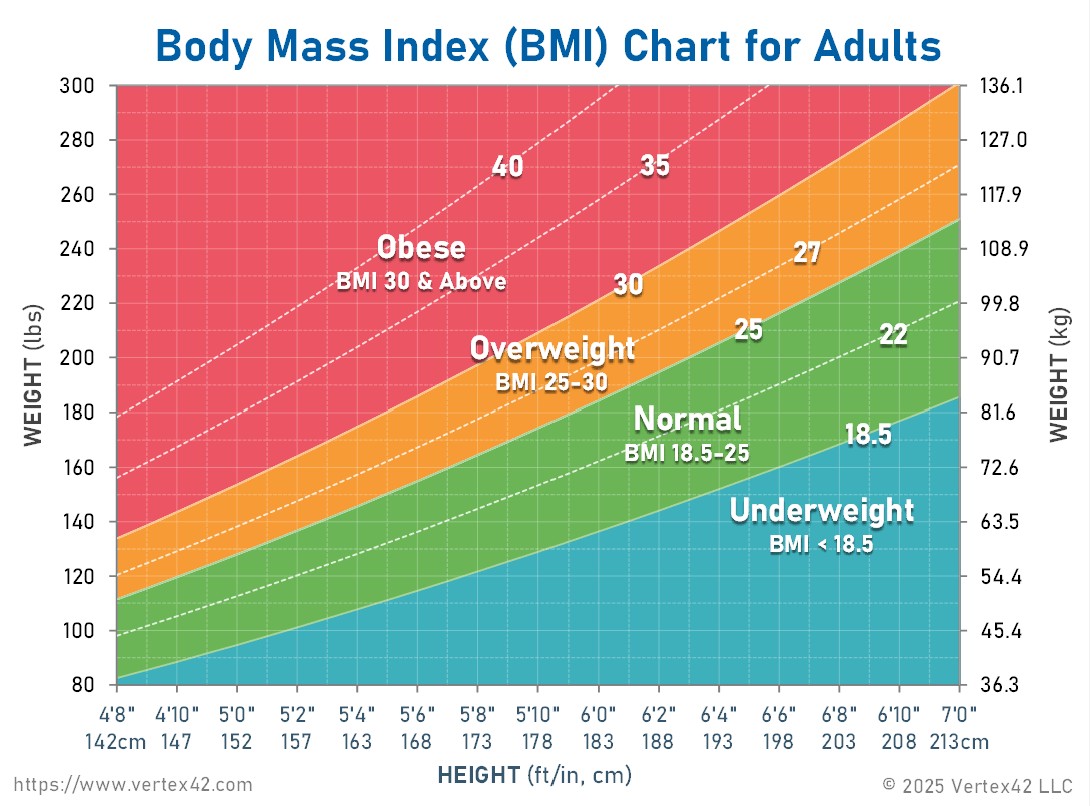
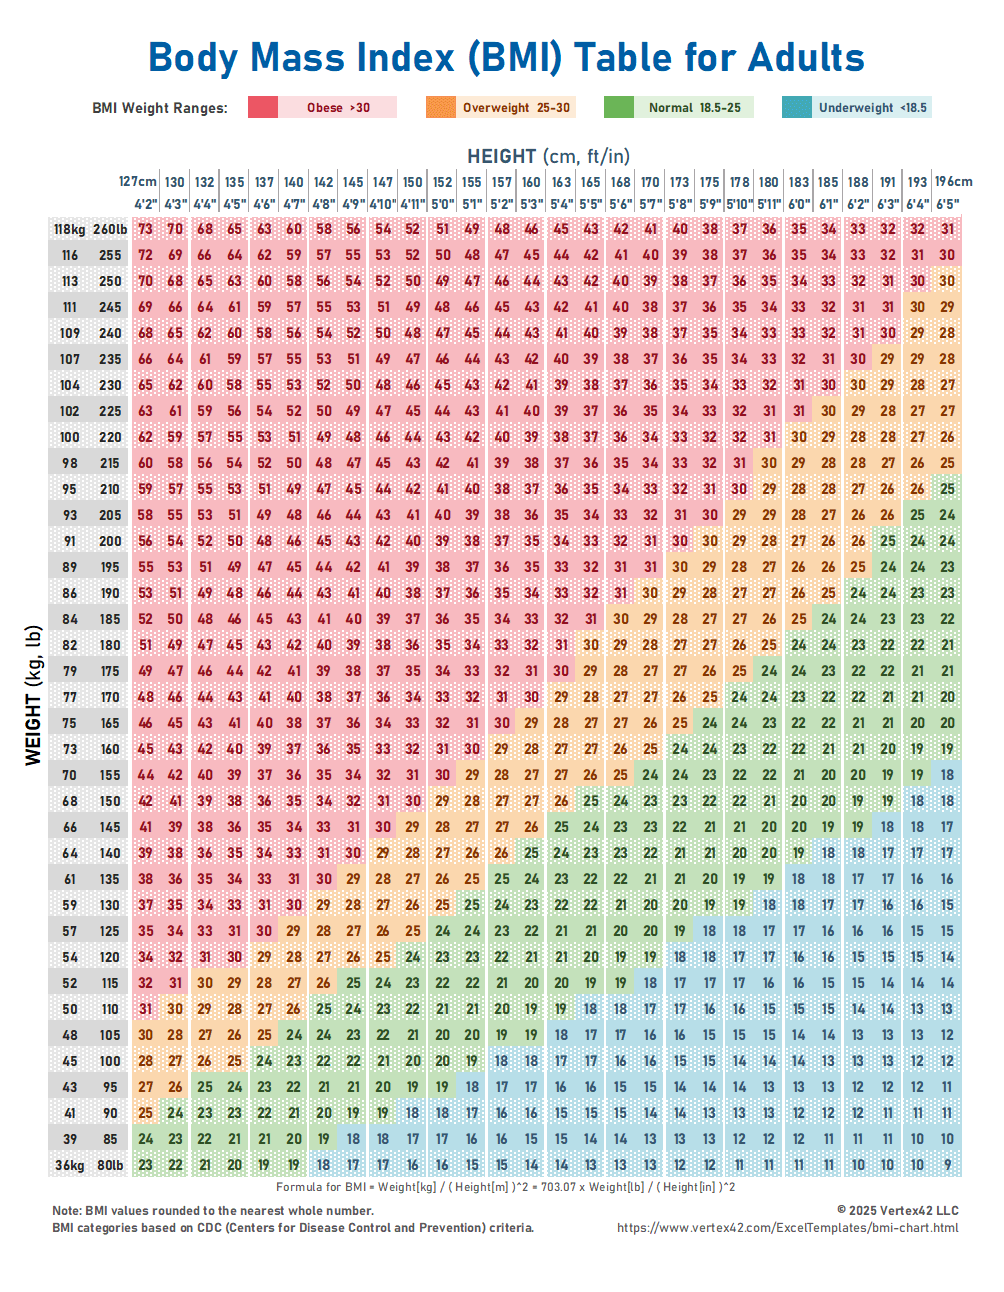
BMI Chart (Body Mass Index)
A BMI Chart or Body Mass Index Chart can be a useful tool for visualizing the ranges for underweight, healthy weight, overweight, and obesity based on a person's height. The simplicity of the BMI formula has made it extremely popular as an initial diagnosing tool for determining a person's healthy body weight. The formula does have its shortcomings because it does not take into account age, frame size, gender, or muscularity.
There are other formulas besides the BMI that are used for determining ideal weight. Our Ideal Weight Chart includes some additional formulas, but keep in mind that "ideal" weight can be highly subjective, and formulas are usually just approximations. Also check out our Weight Loss Charts.
New Printable BMI Charts
BMI Chart and Calculator
for Excel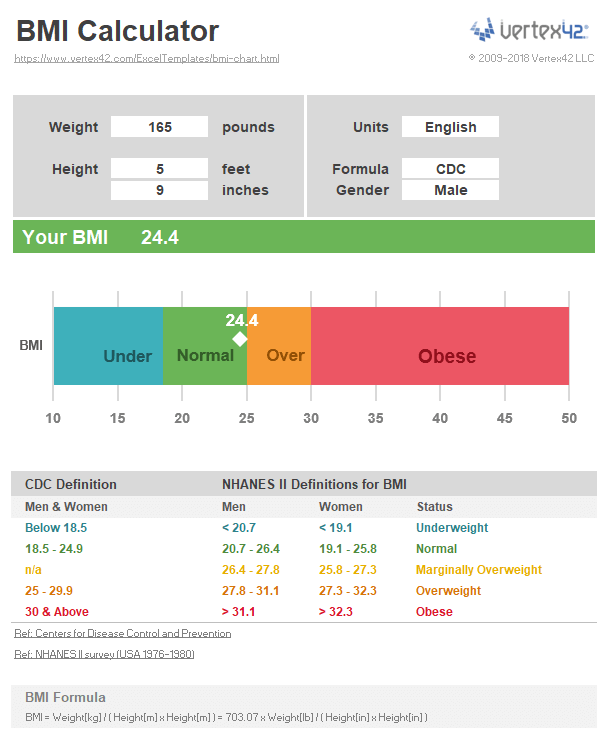
Download
⤓ Excel (.xlsx)License: Private Use (not for distribution or resale)
Description
This spreadsheet for Excel contains a BMI calculator that uses both the CDC and the NHANES II definitions for BMI. The chart shows your BMI on the spectrum based on the chosen formula and gender. This spreadsheet also contains a worksheet used to create the BMI charts listed above (using quite a few special tricks that may delight the Excel enthusiast).
Technically, both the CDC and NHANES II definitions use the same BMI formula. It's only the range of values for each category that is different.
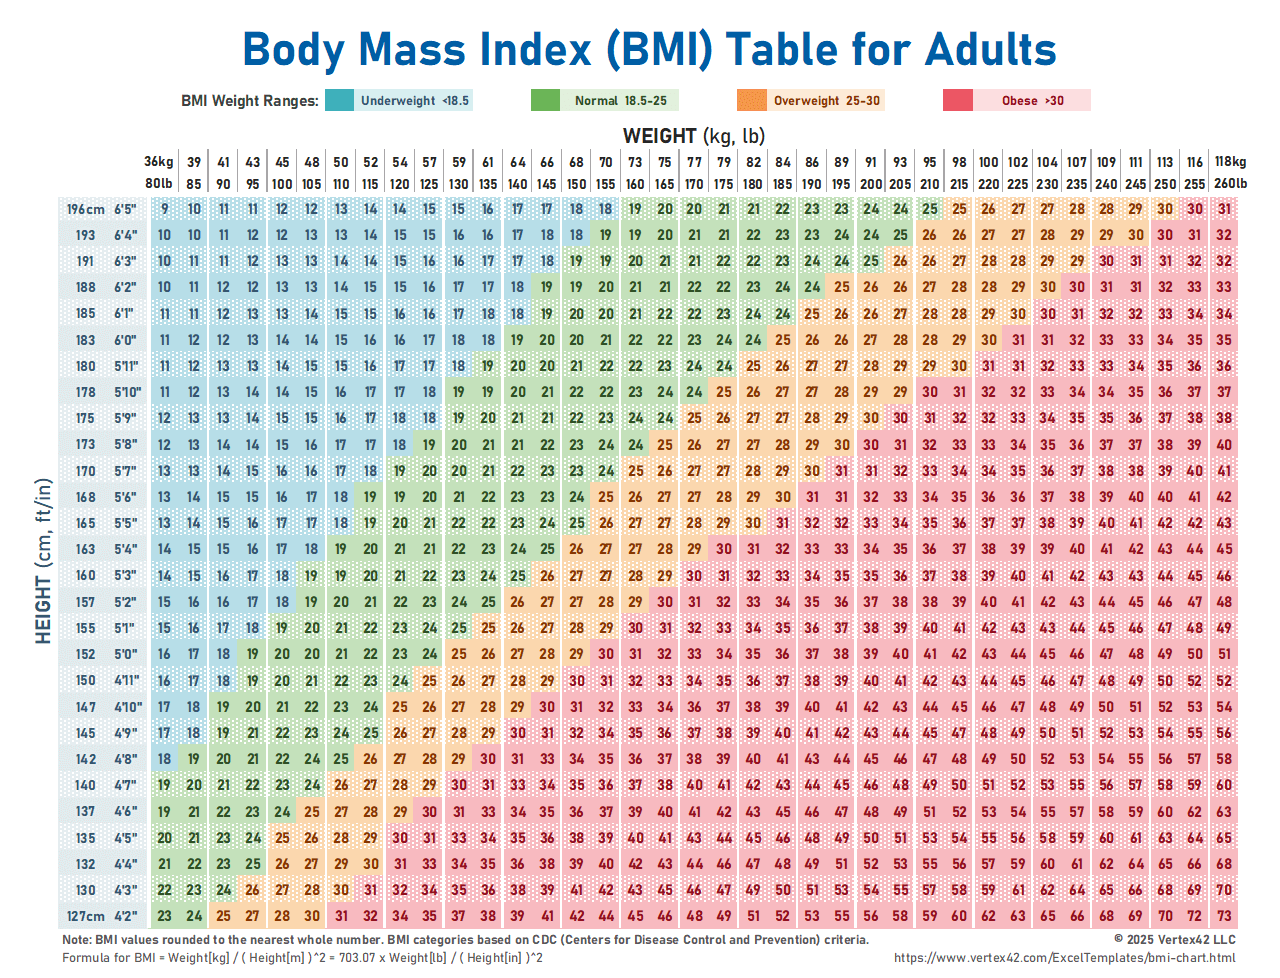
The BMI Formula
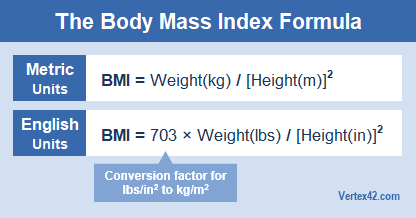
BMI is defined as a person's weight divided by the square of a person's height, using the metric units kg/m^2.
- Metric Units: BMI = Weight[kg] / ( Height[m] x Height[m] )
- English Units: 703 x Weight[lb] / ( Height[in] x Height[in] )
BMI Chart for Children
BMI is calculated the same way for children as for adults, but the criteria for determining a "normal" weight is different. Instead of specific BMI thresholds, a BMI percentile is used to compare to other children of the same age and gender. Just as there are Weight-for-Age, Height-for-Age, and Head Circumference-for-Age growth charts, there are also BMI-for-Age charts.
For children, the weight status category (underweight, healthy weight, overweight, and obese) is defined based on the BMI percentile (less than the 5th percentile, 5th to less than the 85th, 85th to less than the 95th, and equal to or greater than 95th, respectively). See BMI for Children and Teens on the cdc.gov website for the official information.
References
- [1] Body Mass Index (BMI) at cdc.gov - Learn what Body Mass Index is and why it matters.
- [2] Overweight at halls.md - Includes the BMI table from the NHANES II survey (USA 1976-1980).
- Adult BMI Calculator at cdc.gov - Quickly check your BMI and weight category using CDC's tool.
- Child & Teen BMI Calculator at cdc.gov - Calculate BMI percentiles for kids and teens by age (2-19 years old) and sex.