Charts and Graphs in Excel

Skills For the Young Analyst
Charts and graphs are used to make information clearer and easier to understand. A good picture is worth a thousand numbers. The most common place for people to see charts and graphs is in the news. News publishers use graphics all the time to show comparisons and explain important trends for things such as weather, gas prices, crime rate, or who is winning an election and by how much. Charts and graphs are also critical to engineers, scientists and financial analysts who use them to help visualize large amounts of information, make better decisions, and communicate their results to other people.
There are good reasons for learning to create graphs by hand, but there are also some great tools that everyone ought to learn how to use at some point, such as Excel. The purpose of this article is to highlight some of the common types of graphs and charts that you can create with Excel, explain when you might use the different types, and provide a great set of resources for learning about and teaching about charts and graphs.
Bar Graph
A bar graph is a graph that shows you information about two or more discrete objects, events, locations, groups of people, etc. You can use the bar graph to make comparisons. For example, if you count the number of students in your class who are girls and the number who are boys, you could make a bar graph to compare the totals. One bar would represent the number of boys, and another bar would represent the number of girls.
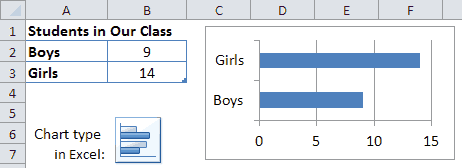
Example of a bar graph created with Excel.
Below are some useful resources for helping kids learn about bar graphs.
Column Chart
A column chart in Excel is just a bar graph where the bars are displayed as columns. Instead of the labels or categories listed on the left, they are listed on the bottom. The example below shows how you can set up the data table for creating a column chart showing the number of apples eaten in a particular month.

Example of a column chart created using Excel
Pictograph
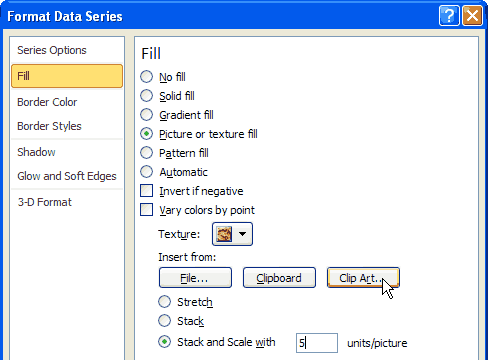
A pictograph shows data using a series of pictures, where a picture represents a number. The example below takes the same data used for the column chart but uses pictures of apples, where one complete picture represents 5 apples eaten. Pictographs can be a fun way to display information, and they are easy to create in Excel. You first create a bar graph or column chart and then you edit the fill options for the bars or columns.
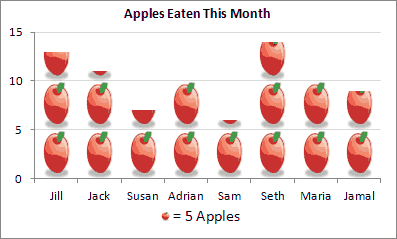
Example of a Pictograph created with Excel
Pictures can say a lot more than numbers. But, it is very important that we don't misrepresent information by the way that we use images and graphics. For example, it would be very confusing if the pictograph above used images of oranges instead of apples to represent the number of apples eaten. We must think about whether the sizes, shapes and colors of graphics are helping to make information more clear and helping to increase understanding.
Line Graph
A line graph is great for showing continuous change over time. For example, you could use a line graph to watch the changes in temperature in the month of March. If it is hotter one day than on the day before, the line will go up. If it is cooler, it will go down. By analyzing the line graph, you can get a better idea of the changes that took place as time went on. You can also easily determine when the value you are graphing was highest or when it was lowest. Including 2 lines on the same graph lets you visualize comparisons, such as the difference between the High and Low temperatures for each day.

Example of a line graph in Excel
Data Source: http://www.beautifulseattle.com/mthsum.asp
You can create a line graph from the same data table as a bar graph, and vice versa. But, what you decide to use should largely depend upon whether you are showing how something changes over time (line graph) or showing comparisons between discrete things (bar graph).
It is important to be aware of color choices when using graphs. People often associate meanings with different colors, such as red for hot and blue for cold, so in the example above it could be confusing if the colors of the lines were switched. It makes more sense for red to be used for the High temperature and blue to be used for the Low temperature.
Pie Charts
A pie chart is a circular graph where the pieces of the pie are used to represent a percentage of a whole. For example, if you took a survey of the students in your class and asked them each about their favorite pizza, you could use the results to make a pie chart that would show what toppings earned the most votes. In this case, each triangle would represent a different topping. The triangle with the largest area would represent the topping that got the most votes, while the toppings that got the least votes would be represented by smaller triangles.
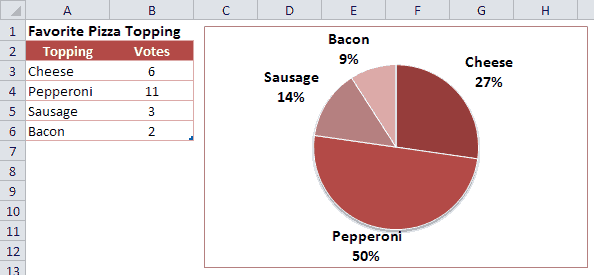
Example of a pie chart in Excel
In the example above, it is pretty easy to see that Pepperoni was the favorite. It is also easy to see that Pepperoni received the same amount of votes as all of the others combined. That would not be as easy to see if you were just staring at the numbers in the table. One problem with a pie chart is that it can take up a lot of space to show only a little bit of information.
Another major problem with pie charts is making comparisons between a lot of different things, and especially when you have a lot of little slices. To help with that, Excel provides a "Bar of Pie" graph that breaks out some of the pieces into a separate stacked bar graph like in the example below.
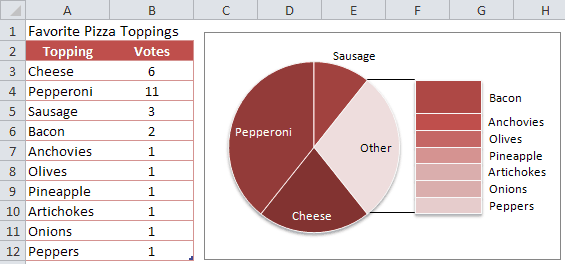
Example of a "bar of pie" graph in Excel
People already have a hard time comparing sizes of areas when they are fairly close in size. But, it is even harder when the areas are different shapes. If you tried to compare Sausage and Bacon in the above example (without using the data table), you could end up coming to an incorrect conclusion. Can you tell why? Is the Sausage slice larger or smaller than the Bacon? Without the numbers to help you, you probably couldn't tell for sure. In fact, the Sausage received 3 votes and the Bacon only received 2. It turns out that the sizes of the rectangles can only be compared within the stacked bar chart. The size of the rectangles cannot be compared to the size of the pie slices - not only because of the difficulty between comparing rectangles and pie slices, but also because the total area of the stacked bar chart is not the same as the total area of the "Other" slice from which it was taken.
Area Charts
An area chart or area graph combines some of the characteristics of line graphs with the characteristics of bar graphs. It looks like a line graph with shading underneath the line. Sometimes, the shading can help add meaning to a line graph. For example, if a line graph represented the height of water in a reservoir over time, shading the area under the line could make the line graph look like actual water rising and falling.
Stacked area charts and stacked column charts provide a way to compare differences or proportions over time or between different locations or groups of people. The height of each of the areas as well as the total height of all the areas may change over time. If you had a series of pie charts that compared the same items from month to month, all of that information could be displayed in a single area chart. For example, let's say that a teacher offered the same pizza topping survey to each of her classes over a period of 10 years. You can display that information as an area chart like the image below.
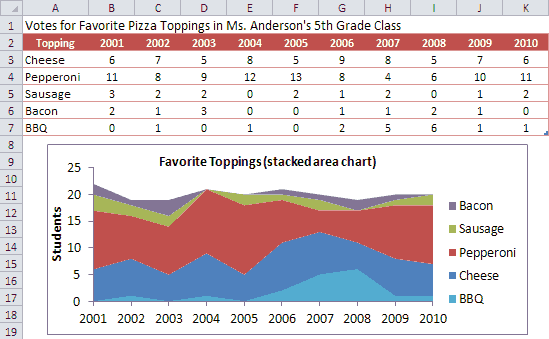
Example of a stacked area chart in Excel
This type of area chart is time-based (same survey offered year after year), but it's not truly continuous because the class stays the same throughout the entire year. So, this is a case where it might be more appropriate to show the graph as a stacked column chart (see below) which will depict the results as discrete events. Everything about the data table and the graph is pretty much the same. All you have to do is change the chart type.
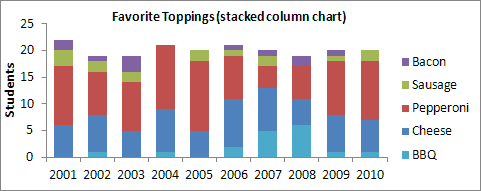
Example of a stacked column chart in Excel
XY Graph (Scatter Plot)
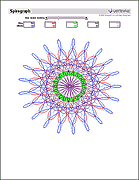
An X-Y graph, also called a coordinate graph or scatter plot, is a graph that shows different ordered pairs on an X-Y axis (Cartesian coordinate system). X-Y graphs are used to look at and find patterns in sets of data and to plot mathematical formulas. The points on the graph may form a straight line or a curved line, and may be connected with a line. Unlike bar graphs and line graphs, the line in an X-Y graph can curve back on itself, forming complex patterns such as the spirograph shown on the right. In some cases, the points may not form a line at all. They might just be shown as a bunch of random dots scattered all over the place (thus the name).
To plot a point on graph paper, you first need to draw the coordinate system and then you simply find the point's x-coordinate, move straight up or down the line to its y-coordinate, and draw a point. To create a scatter plot in Excel, you first create a simple table with one column for listing the X-coordinates and a second column for the Y-coordinates, select the data table, then insert the scatter chart by choosing it from a menu.
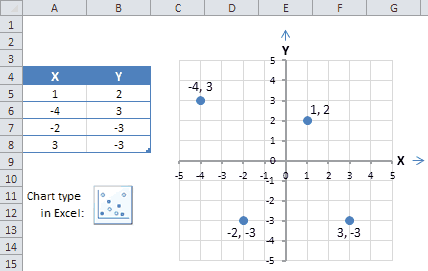
Example of a scatter plot in Excel
More information about scatter plots:
Other Charts and Graphs
There are many other types of charts and graphs, as well as many other variations on the types listed above. But most of the more advanced types of graphs, charts, and plots require a more advanced knowledge of math, science, and statistics. Some of the names for these other types of charts (but definitely not all of them) are: surface plots and other 3-dimensional graphs, bubble charts, candlestick charts, radar plots, forest plots, glyph plots, histograms, stem-and-leaf plots, dot plots, biplots, box plots, gauge charts, control charts, geo charts, tree maps, combination charts, stepped area charts, dendrogram plots, and many others.