SCURVE
=SCURVE(startdates, enddates, values, [is_daily], [weekend], [holidays], [percent])
| Argument | Description | Example |
|---|---|---|
| startdates | A column of task start dates | see below |
| enddates | A column of task end dates | see below |
| values | A column of values for each task (typically work hours or cost) | see below |
| is_daily | (Default=FALSE) If TRUE, values are assumed to be daily rather than totals | FALSE |
| weekend | (Default="0000000") A string defining the weekend days such as "0000011" for Sat/Sun | "0000000" |
| holidays | (Default={0}) An array defining holiday dates | {0} |
| percent | (Default=FALSE) If TRUE, the cumulative result is scaled to [0,1] to represent percent complete | FALSE |
⤓ Get the Template (Filename: s-curve-template.xlsx)
Description
The SCURVE function automates the process of converting a table of project tasks and costs into a format that can be easily graphed as an s-curve.
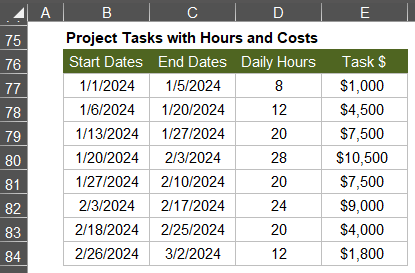
Most project schedules are defined by a table of tasks with columns that include start dates and end dates. There may also be values associated with each task such as daily manhours, total hours, or costs. The table below shows the sample project data that we'll use in our examples.
What is an S-Curve?
In project management, an S-Curve is a chart that shows the cumulative work hours or cumulative cost of the project vs. date. The name comes from the shape of the curve, though it is often a very flattened S. In statistical terms, when scaled to [0,1] the s-curve represents the cumulative distribution of work or cost over the life of a project.
Example
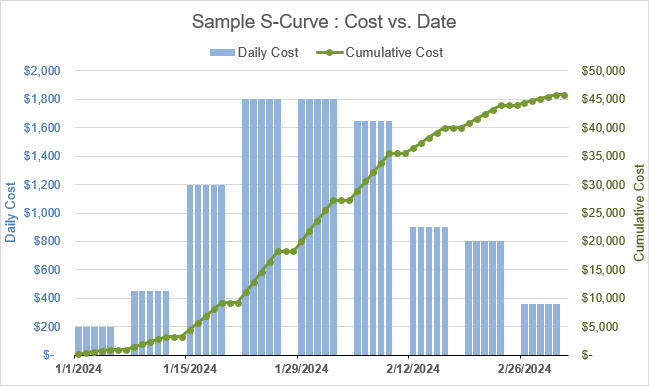
The chart below shows both the daily cost and the cumulative cost (the s-curve) for our sample project. Note the shape of the green Cumulative Cost line (a flattened S).
⤓ Get the Template (Filename: s-curve-template.xlsx)
Option: is_daily
In the above table, the Daily Hours column represents the number of manhours required per day for each task. So, if we are using this column for our values, then we need to specify TRUE for the is_daily parameter.
The Task $ column in the above example represents the total cost of each task, so we would use is_daily=FALSE (or leave the parameter blank because FALSE is the default).
Options: weekend and holidays
The SCURVE function allows you to ignore weekends and holidays by defining the parameters just like you would for the NETWORKDAYS.INTL function. SCURVE uses NETWORKDAYS.INTL to calculate the work days for each task.
In our example above, we are using weekend="0000011" to indicate that no work is being done on Saturday or Sunday.
The Output
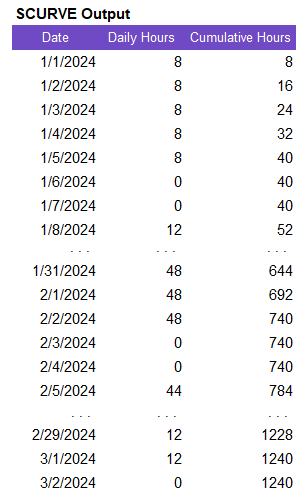
To generate an S-Curve graph like the one above, SCURVE converts a table of tasks to a table that can be easily graphed consisting of 3 columns: (1) The date, (2) The daily value, and (3) The cumulative value.
=LET(
    start_dates, B77:B84,
    end_dates, C77:C84,
    values, D77:D84,
    is_daily, TRUE,
    weekend, "0000011",
    SCURVE(start_dates,end_dates,values,is_daily,weekend)
)

Result: See SCURVE Output image below
The graph of this table is shown below, using a combo chart where the Daily Hours column is a column chart and the Cumulative Hours column is a line chart. You can convert the horizontal axis to a date axis to control the spacing of the labels (# of days or # of months).
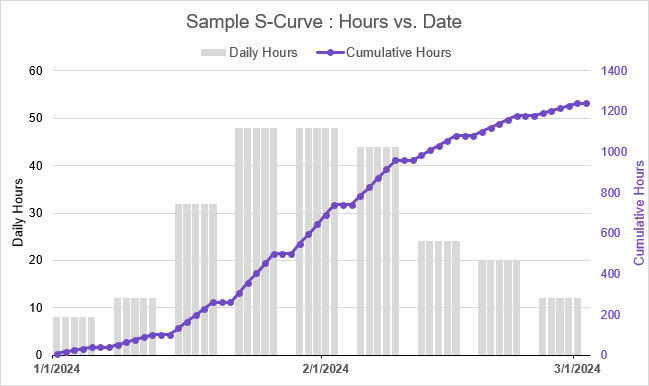
Although many S-Curve charts are only showing the cumulative result, I find it useful to visualize the daily work load or daily spending.
Another reason for including the daily values in the result is so that you can easily see and verify how the weekend and holidays parameters are affecting the results.
How to Easily Create the S-Curve Chart
To create the S-Curve chart without the daily values, you just select the column of dates and the cumulative value column and go to Insert > Charts and choose a suitable chart type (line, scatter, column, etc.).
To create the Combo Charts like the ones shown above:
- Select the entire range returned by SCURVE
- Go to Insert > Recommended Charts
- Select the All Charts tab
- Select Combo from the bottom of the panel on the left
- Select Clustered Column-Line on Secondary Axis (see the image below)
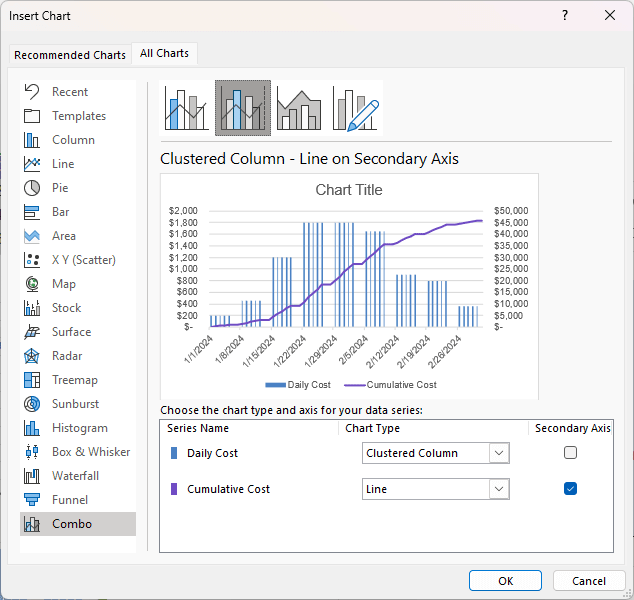
These steps will get you 90% of the way there. Additional formatting such as chart title, axis titles, axis scaling, bar width, bar gap, and color is up to you.
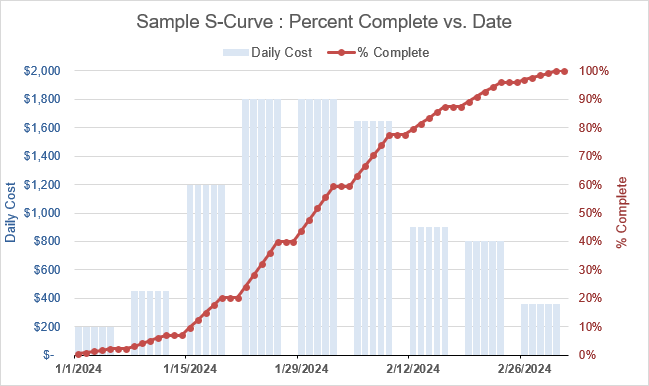
Percent Complete vs. Time
To create a baseline or target s-curve representing percent complete vs. date, you can set the percent option to TRUE, which scales the cumulative result to [0,1].
Invalid Dates and Other Gotchas
Invalid Dates: SCURVE will filter out any rows with dates that are text or blank, or if the end date is less than the start date. Dates must be valid numeric date values >0. You won't be warned about invalid dates, so make sure your inputs are valid.
No Date-Time Values: The NETWORKDAYS.INTL function does not work with datetime values (or rather it will truncate all time information), so use only dates, not datetime values.
Avoid including summary tasks: Be careful to avoid including summary tasks that include subtotals, or values may be counted twice. You may need to first remove rows that contain subtotals. SCURVE cannot tell whether a value is a subtotal or not.
Lambda Formula
This code for using SCURVE in Excel is provided under the License as part of the LAMBDA Library, but to use just this function, you may copy the following code directly into your spreadsheet.
Code for AFE Workbook Module (Excel Labs Add-in)
/**
* Create an S-Curve from Project Task Dates and Values
*/
SCURVE = LAMBDA(startdates,enddates,values,[is_daily],[weekend],[holidays],[percent],
LET(doc,"https://www.vertex42.com/lambda/scurve.html",
    weekend,IF(ISOMITTED(weekend),"0000000",weekend),
    holidays,IF(ISOMITTED(holidays),{0},holidays),
    is_daily,IF(ISOMITTED(is_daily),FALSE,is_daily),
    percent,IF(ISOMITTED(percent),FALSE,percent),
    table,HSTACK(startdates,enddates,values),
    ftable,FILTER(table,
        NOT(ISTEXT(startdates))*(startdates>0)*NOT(ISTEXT(enddates))*(enddates>0)*(enddates>=startdates)
    ),
    start,CHOOSECOLS(ftable,1),
    end,CHOOSECOLS(ftable,2),
    days,BYROW(HSTACK(start,end),LAMBDA(row,
        NETWORKDAYS.INTL(CHOOSECOLS(row,1),CHOOSECOLS(row,2),weekend,holidays)
    )),
    val,CHOOSECOLS(ftable,3),
    daily,IF(is_daily,val,val/days),
    dates,SEQUENCE(MAX(end)-MIN(start)+1,1,MIN(start),1),
    date_total,BYROW(dates,LAMBDA(date,
        SUMPRODUCT((NETWORKDAYS.INTL(date,date,weekend,holidays)=1)*(start<=date)*(date<=end)*(daily))
    )),
    cumulative,SCAN(0,date_total,LAMBDA(acc,f,acc+f)),
    HSTACK(dates,date_total,IF(percent=TRUE,cumulative/MAX(cumulative),cumulative))
));
Named Function for Google Sheets
Name: SCURVE
Description: Create an S-Curve from Project Task Dates and Values
Arguments:
Function:
[in the works]
How SCURVE Works
Walking through the SCURVE function...
- The defaults for the optional parameters weekend, holidays, is_daily, and percent are handled.
- The table parameter is defined by horizontally stacking the start dates, end dates, and values.
- The table is filtered to remove rows with blank or invalid dates. The date values are not allowed to be text, and the values must be >0 (which means they cannot be blank).
- The number of days for each task is calculated using NETWORKDAYS.INTL
- The daily value for each task is either the value given (if is_daily=TRUE), or the total value divided by the days.
- dates: The column of dates for the ouput is defined using SEQUENCE
- date_total: For each individual date, we calculate the total value for that date, or it is zero if a weekend or holiday.
- cumulative: Calculated as a cumulative sum of date_total column.
- The output is formatted as 3 columns (with cumulative scaled if percent=TRUE).