Depreciation Schedule
Depreciation is a term used to describe the reduction in the value of as asset over a number of years. A Depreciation Schedule is a table that shows the depreciation amount over the span of the asset's life. For accounting and tax purposes, the depreciation expense is calculated and used to "write-off" the cost of purchasing high-value assets over time. Usually a company will want to write-off the asset (meaning turn the cost into an expense) as soon as possible in order to increase the after-tax present worth, or profitability, of an asset. For this and other reasons, governments often regulate the different depreciation methods that eligible companies use.
This page is the first of a 3-part series covering Depreciation in Excel.
- Part 1 provides a Depreciation Schedule for financial reporting and explains the formulas used for the basic common depreciation methods.
- Part 2 discusses how to calculate the MACRS depreciation Rate using Excel formulas.
- Part 3 provides a Depreciation Calculator that can be used to analyze the depreciation of an asset, including both basic methods and MACRS.
Depreciation Schedule Template
for Excel and OpenOffice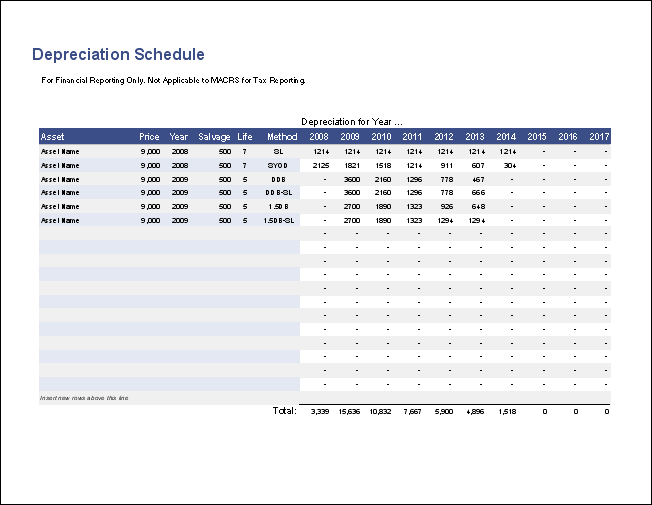
Download
⤓ Excel (.xlsx)Other Versions
License: Private Use (not for distribution or resale)
Description
For Financial Reporting. Not to be used for Tax Reporting.
This Depreciation Schedule template provides a simple method for calculating total yearly depreciation for multiple assets.
- For each asset, choose between the Straight-Line, Sum-of-Years' Digits, Double Declining Balance, or Declining Balance with Switch to Straight-Line.
"No installation, no macros - just a simple spreadsheet" - by Jon Wittwer
Depreciation Formulas in Excel
There are a number of built-in functions for depreciation calculation in Excel. These include SLN (straight-line), SYD (sum-of-year's digits), DDB (declining balance with the default being double-declining), VDB (declining balance with switch to straight-line), DB (fixed-declining balance), AMORDEGRC, and AMORLINC. I won't be discussing the last 3. See the description of the various depreciation methods below for how to use the depreciation formulas in Excel.
Depreciation Methods
There are many different depreciation methods. Some are used for financial reporting and others are used for tax reporting. The methods described below are some of the more basic methods used for financial reporting. For tax reporting in the United States, the Modified Accelerated Cost Recovery System (MACRS) is used, which makes these methods a bit more complicated (see Part 2: MACRS Depreciation Formulas).
Straight-Line Depreciation (SL)
Straight-line depreciation is the simplest depreciation method to calculate. The amount of depreciation each year is just the depreciation basis, Cost (C) - Salvage Value (Sn), divided by the useful life (n) in years:
Dj = (C-Sn)/n = d*(C-Sn)
=SLN(C, Sn, n)
In the straight-line method, the depreciation amount is a constant percentage of the basis, equal to d=1/n. For a useful life of 5 years, the depreciation rate (d) for years 1 through 5 is 1/5, 1/5, 1/5, 1/5, 1/5. The total sums to 5/5 or 100%.
The straight-line methods used in the MACRS system are a little different because they take into account the time of year that the asset was placed into service and follow a half-year, mid-quarter, or mid-month convention. See the MACRS Straight-Line Depreciation Formula.
Sum-of-Years' Digits (SOYD)
The SOYD depreciation method is a fairly simple accelerated depreciation method. Accelerated depreciation methods are based on the assumption that an asset is more useful when it is newer, and therefore more of the cost should be written off in earlier years than in later years. The SOYD depreciation formula is:
Dj = (C-Sn)(n-j+1)/T where T=0.5n(n+1)
=SYD(C, Sn, n, j)
Instead of a constant percentage each year as in the SL method, the percentage used to calculate the depreciation for year j is (n-j+1)/T where T is the sum of the digits 1, 2, ... n. T can be calculated as T=0.5n(n+1).
Example: For a useful life of 5 years, T is equal to 1+2+3+4+5=15 and the percentages for years 1 through 5 are therefore 5/15, 4/15, 3/15, 2/15, 1/15. Notice that these percentages sum to 100%.
Declining Balance Depreciation
In the declining balance method, the depreciation for year j is calculated by multiplying the book value at the end of the prior period (cost - accumulated depreciation from prior periods) by a fixed depreciation rate, d. This method is commonly called the Double-Declining Balance Method because the depreciation rate that is used is usually double the straight-line rate or d=2/n. The factor 2 is often specified as 200%. The depreciation formula for year j is:
Dj = min(d*BVj-1, max(0, BVj-1-Sn) )
BVj-1 = C(1-d)j-1
=DDB(C, Sn, n, j, factor)
where d=factor/n.
=VDB(C, Sn, n, j-1, j, factor, TRUE)
The Book Value is not allowed to be less than the Salvage Value. The Salvage Value is not included in the Book Value calculation for the declining balance method, so that necessitates the use of the MIN and MAX functions in the above formula. The Excel function, DDB(), handles all of that for you.
The VDB (variable declining balance) function is a more general depreciation formula that can be used for switching to straight-line (see below). The boolean value TRUE as the last argument tells the function NOT to switch to straight-line.
Declining Balance Depreciation with Switch to Straight-Line
It is common for a company to switch from the declining balance depreciation method to the straight-line method in the year that the depreciation from the straight-line depreciation method is greater. The VDB function has this feature built-in. The formula for calculating the depreciation for year j is:
Dj = VDB(C, Sn, n, j-1, j, factor, FALSE)
where factor = 200%, 150% or 125%
MACRS System for Tax Reporting
The U.S. MACRS System is highly regulated and adds quite a bit of complexity to the simple depreciation formulas. You should consult IRS Publication 946 to determine how to depreciate your property for tax purposes.
Even though the MACRS includes a straight-line and declining balance method, the Depreciation Schedule on this page should not be used for tax reporting, because it doesn't take into account the different conventions in the MACRS (half-year, mid-quarter, and mid-month).
Depreciation Terms
Cost (C): This is the purchase price or cost of the asset.
Salvage Value (Sn): The salvage value is the estimated value of the asset at the end of the depreciation period.
Depreciation Period (n) or Recovery Period: This is the estimated useful life or service life of the asset in years.
Depreciation Basis (C-Sn): The depreciation basis is the portion of the cost used to calculate the depreciation and is usually the cost minus the salvage value. However, for some methods like declining-balance depreciation or the accelerated cost recovery system (ACRS), the depreciation basis is the unadjusted full purchase price.
Book Value (BVj): The book value is simply the difference between the purchase price and the accumulated depreciation. The book value at the end of 5 years of depreciation is denoted BV5. The book value is used for accounting and calculations. It does not have anything to do with the market value of the asset. In the declining balance depreciation method, the book value at the end of the depreciation period does not equal the salvage value.
Date Placed in Service: Unlike the MACRS which applies a half-year, mid-quarter, or mid-month convention and requires knowing when the asset is placed in service, the depreciation methods included in the Depreciation Schedule require only specifying the first year that the asset is placed in service.
>> PART 2 - MACRS Depreciation Formulas in Excel
Depreciation References
- Depreciation at wikipedia.com
- How to Depreciate Property, IRS Publication 946 at IRS.gov
- Templates for Calculating Depreciation at support.office.com