◄ Return to the Gantt Chart Template Page
I was recently asked if my Gantt Chart Template could be used to compare actual dates to original project dates. The simple answer is "yes, depending on how you want to show the difference." In this post, I'll explain how you can do this using the new version of the Gantt Chart Template Pro that makes it easy to see visually.
1. Keep a Backup Copy of the Original Project Plan
Keeping a backup is always a good idea, and this is the most basic approach for keeping a record of the original plan. You can view files side-by-side or compare printouts.
2. Make a Copy of the Gantt Chart Worksheet and Rename It
You can make a copy of the Gantt Chart worksheet within the same workbook and rename the worksheets GanttChart-Actual and GanttChart-Plan (see the image below). Of course, these worksheets will be entirely independent, but it's an easy solution for keeping a copy of the original project plan. This still doesn't provide a good solution for easily comparing planned and actual dates, though.
Screenshot showing separate Plan and Actual worksheets
3. Add New Columns for Storing the Original Dates
It's easy to insert new columns in the XLSX version of the Gantt chart. Many people do that to add a budget column, and in this case you could add columns to keep track of original start and end dates.
With the new columns, you can compare dates side-by-side, but that still may not be as visual as you'd like.
4. Showing the Original Dates in the Gantt Chart
The first two approaches don't make it easy to visually compare differences between the planned and actual dates. The third method gets us part way there, but many people have wanted to see the differences in the Gantt Chart itself.
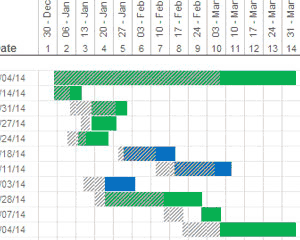
Thanks to Excel 2007+, which provided a more powerful set of conditional formatting rules than Excel 2003, it is possible to show the planned and actual project dates within the same chart. The screenshot below shows a new feature of Gantt Chart Pro that provides an option for displaying original dates as a diagonal fill pattern.
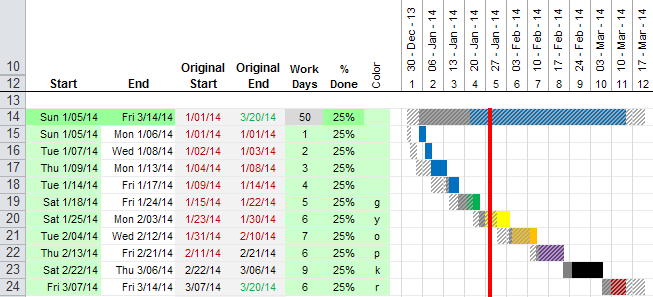
Screenshot showing a comparison of the actual vs. original dates in the Gantt Chart Pro version 4.0 (click to view larger image)
You'll see that this new version includes two new data entry columns: Original (or Planned) Start and Original (or Planned) End. After you create your plan using the normal approach, you can copy the dates from the Start and End columns into the two new columns using Copy and Paste Special > Values.
You can hide the Original Start and Original End columns if you do not want to use them or display them. You can also turn on/off the display of the original dates in the Gantt Chart by unchecking a box or using a drop-down option.
Current customers can return to the download page for Gantt Chart Pro to get a copy of the new version.
Planned vs. Actual in Google Sheets and Excel Online
Update 3/19/2019: Although cross-hatching isn't currently possible as a conditional formatting option in Google Sheets (or Excel Online), I figured out how to implement it using text ("////"). So, the Pro version includes the option to display the original planned schedule, as demonstrated in the image below.
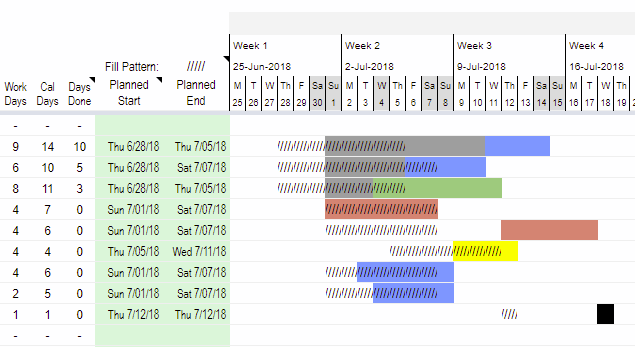
Screenshot showing Planned vs. Actual dates in Google Sheets
Let Me Know What You Think
If you would like to comment on this feature, or offer suggestions, please do so using the Comments section below.


Comments
Wonderful.
I am getting a break in the formatting in the Gantt chart when using the monthly display but not in the weekly display
@Don … not sure what you mean. Can you email a screenshot or something? See the contact page for the email address.
Hi,
The new feature sounds nice.
I have some questions:
1. Could you add some more color schemes?
2. Could you make it possible to choose between entering the begin and end date of a project. The same goes for the different tasks. The user could setup the project settings in the beginning.
3. I would also have the option not to use only the number of weeks but also the week numbers of that year/month. this is sometimes useful when talking to people. they like to know which week of the month the task will be.
regards,
Ger
@ger … thank you for the suggestions. #1 can be done by adding more conditional formatting conditions. #2 is already possible by using different template rows. One of the demo videos shows this. #3 is also something that could be added fairly simply if you use the WEEKNUM() function to calculate the week number for a given date.
Hi,
I would like to know if there is any template where you can compare actual progress vs planned progress in construction. Could you pls guide me on this if possible..
Thanks.
@Mishal, I’m afraid that this blog article is the only documentation I have describing what you are asking about.
Does this app work on Mac (OSX) computers.?
@hmoussly, If by “app” you mean the Gantt Chart Template … it should work in the latest versions of Excel for Mac (Excel 2008 if you use the .xls file and Excel 2011 if you use the .xlsx file).
Hi, I am not sure how i can show all the months. e.g. in Gantt chart, I can only see the months Oct,Nov,Jan but I do wish to view Dec and Feb too but am not sure how i can display them.
@Nira, I’d need more information (via email) to answer your question. To display a longer time span, you could select Weekly or Monthly from the drop-down list.
I have the 6/9/2010 created version of gantt chart pro template with the 2.4 beta version of actual vs. planned. Is that the latest version? I check before I carry over our normal gantt chart to the new version. Looks good….
K
@KCarr, there have been a few minor changes since 2.4.0, but probably nothing major enough to warrant moving data to the newest version. However, it would be good to start new projects with the latest version.
Thanks for the reply John. How do I get the newest version?
K
@Kevin, To return to the download page, you can follow these instructions. If that doesn’t work, send me an email, and I’ll send you the file(s).
As for the requested feedback. Definitely do number B where that it is within the “base chart”. Huge amount of work to carry over a std chart to the new one….
Others are good for my use.
K
I like the GanttChart Beta. Here are a couple tips that I think would be helpful
1. Original dates could be links to Gantt chart tab Start/End cells
2. I would like to have a button that when pressed hides all sub-tasks rows so that I can print a summary of just task categories
Great work, I think this is a great tool!
It is very convinient to spread and share project targets and status within a diverse team. Work efficiency is approved to be higher.
There seems to be a problem with the locked formula that creates the oblique hatching in line 13. The hatching continues all the way to the right no matter what values show up in the controlling cells.
The rest seems to work great and after a small learning curve I am quite pleased.
Thanks
@Ken, I’m afraid I am unable to reproduce what you are seeing. For me (using Excel 2010), the spreadsheet is behaving correctly (as shown in the screenshots in this post).
I’m having the same error that Ken Dewar was experiencing. How was this resolved?
@Dave, I don’t think I ever got a follow-up from Ken that allowed me to reproduce the error. Emailing me your file would be required for me to diagnose the problem further, as all of the files that I have work fine.
I hate to appear stupid but I would like to use the beta version and cannot figure out how to get a clean template???
@Ted, I’m not sure what you mean by “clean” template. For assistance, please email me using the email address listed on the about/contact page.
I have just recently begun to use the Gantt Chart Pro, Beta version. In answer to your queries above:
A. I really like the conditional formatting. Being able to see at a quick glance whether one is ahead or lagging on a given task is of great value.
B. Since I began use on the Beta version, I have been using it exclusively although I admit that I do miss the “Days done” and “Days left” on the original gantt chart.
C. I like the fill patterns as they are at present.
D. I like the current arrangement of the diagonal lines when they only show up if the original dates are different from the current dates.
Thanks for a terrific product!
I like the feature but I keep losing the Gantt Chart.
If I delete a row, my chart is emptied and the dates for the chart go to 01/00/00.
I was trying to add about 20 rows by highlighting 20 rows and doing insert. Totally removed the color bars in the chart. Choosing Undo removes the inserted rows but does not restore the chart.
Is there a way to re-map/re-draw the graph if it is wiped out?
For Vansh Sharma — I found these 2 columns in your B. They are hidden in columns N and O.
Thanks
John D
@John D … It’s hard to know what is going on without having you email the file. When deleting a row, if all the dates change, then some other date was likely linked to the date in the row that was deleted. Inserting rows should not change things in other rows, so something weird is going on in your file. Email for help and attach the spreadsheet after inserting rows if you want additional help.
User error on my part.
Jon
Am using Gantt Chart Pro Beta(purchased).Looking through FAQs and Forum to find how to have Project Level Start and End dates.
I’ve been thinking of creating a non-WBS row before WBS 1 and using =Max(zx:zn) to fill in an end date.
Will Gantt color bar be useable to track the end-to-end project timeline, assuming I manually put in a %Complete.
What pitfalls to watch for?
Thanks
John D
@John. Try it and see. You don’t need a WBS number for the bars to show up. If you copy a template row and insert it above WBS 1, then the bars should show up if you enter the start/end/days. A project end date is probably something I should add below the Project Start Date, and it would be calculated using MAX().
Jon
Thanks.
I tried it and it works nicely.
I agree with your idea about adding the Project End Date somewhere. Under the Project Start Date is fine.
John D
Jon
Where is the array for Urgency.
I’d like to use the urgency colors but want to use different number of days.
Thanks
John D
@John, The urgency values are defined in the Help worksheet.
For the Gantt pro, can you sort by Task Lead?
@John, If you are using the automated WBS numbering formulas instead of entering WBS numbers manually, then you shouldn’t sort. Possible to sort, yes, but if you do it will likely mess everything up unless you enter WBS numbering manually. You can use Excel’s filtering feature because that just hides rows instead of sorting them.
I want Work days include the weekend. How can i do it?
@Henry, In the gantt-chart_o365.xlsx and gantt-chart_intl.xlsx versions, you can define exactly what is considered a “work week” via the options in the Help worksheet. For the version shown in this blog article (file gantt-chart.xlsx) you can use the template rows that calculate the end date based on calendar days instead of work days if your work week is a 7-day period. The demo video and help worksheet explain how to use the different template rows to define the start/end dates and durations in different ways.
Can you make a video of it?
I don’t quite understand how to use it.
I have bought it, but don’t know how to make it work for my gantt chart.
I would like to use the “GanttChart-BETA” sheet for one of my projects. I was wondering if there is any way to remove the link box that brings you to this page found at the top of the sheet in Excel. I do not want this box to appear on my printed schedules. Please advise.
@John … Right-click on the shape object and press Delete.
Thanks Jon. I should of known to try that.
HELP!!!! I cannot figure out how to do the predecessors and I’ve spent three days on a huge project schedule that was due today. Can someone talk me through this please… like now? I’m desperate. I am the PMO of the entire project and I cant seem to conquer this simple spreadsheet. 713.202.2757
@Teresa, You can email me, but I don’t provide phone support. My first suggestion would be to watch the video that explains how to use the template rows. You need to be using the template rows that have the predecessor column highlighted green and either the calendar days or work days highlighted green. These template rows use a formula for calculating the Start Date based on the WBS value in the Predecessor column. If you aren’t using the correct template row, you could also just copy Start Date cell from a template row that uses the Predecessor column and paste it into the Start Date cell of the tasks where you want to use it. To use the Predecessor column, just enter a reference formula like =A25 where A25 is the cell containing the WBS of the predecessor task in row 25. When you email, please either send a copy of the file you are working on, or be very specific about what you are wanting to know or what confusion you are having.
Whenever I populate a cell in the Quantity column (and in turn it values the PROD column) I lose the color in the graphic part of the schedule (bar turns dark grey). Any help?
@Brad. The Gantt chart template doesn’t include a Quantity or Prod column, so you may be using a customized version. I would recommend directing your question to the person who customized the spreadsheet for you.
Thanks for nice information, Can P6 be interfaced to an Asset Management system & will it prepare the optimum project scheduling with accessible time, budget and resources???
@VJBaskar, No. It’s a spreadsheet without any VBA or built-in optimization.
Hello
I’ve been asked to format a gantt chart to show actual start dates compared to planned start dates. If the actual start date is before the planned date I want it to go one colour, and if it actually starts after originally planned I want it to go a different colour. is it possible to have too colours? I can only make it go one or the other at the moment using =actualbeyond
Thank you
@Sam, Almost anything is possible with Excel, but the functionality you are asking for is not already built into the template. It also depends on which template you are talking about, what version of Excel you are using, etc. If you need help customizing a spreadsheet, you can email me the details, but if it’s something that will take more than a few minutes of my time to explain, you may need to contact an Excel consultant to help you customize your spreadsheet.
In Gant char pro, how can i make the task column value be next to the colored bars and follow them according to changed resolution (Q,monthly,weekly,daily)?
@ziv … If I understand what you are asking, you can either use a split screen (View > Split) or you could try hiding the columns between the Task column and the Chart area. If that doesn’t answer your question, please explain what you mean by “follow them according to …”
Great feature
Hi, it’s a great website there. Thanks for this info