Data Tables in Excel can be a powerful tool, and there are many great tutorials for how to use them for analysis, simulation, and even Monte Carlo Simulation.
One of the limitations has been that you can only use them for up to 2 input variables and one output variable. However, I'm going to show you how to set up an x-Variable Data Table that allows multiple inputs and multiple outputs in a single Data Table.
Quick Review of Setting Up a 1-Input/1-Output Data Table
To set up a Data Table in Excel, your model needs to accept at least 1 input and calculate at least 1 output. Let's say your input is in cell C4, and your output is in cell C5. Creating a data table is a bit tricky to set up, but it looks like this:
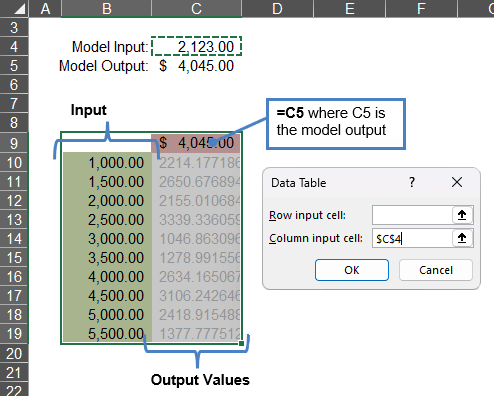
The upper right cell needs to be a cell that references your output, in this case, =C5. The green highlighted cells on the left are the inputs. You need to enter these values either manually or using a formula.
Create the Data Table by going to Data > What-If > Data Table, and select C4 as the Column Input.
When you click OK and after each time recalculating the worksheet, Excel takes one value from the left column of the table at a time, puts that value into cell C4, then takes the output from C9 (which references C5) and puts that in the column on the right. This is a sequential process, so it can slow down your spreadsheet, but when you need to use it, it can be powerful.
x-D Method 1: Using an Indexed Array of Inputs
Although not the main focus of this article, one great way to create an x-Input Data Table is to first create a separate array (or table) of input values using a separate column for each input. Each row is a separate combination of inputs. As an example, see the Input Array table in the screenshot below.
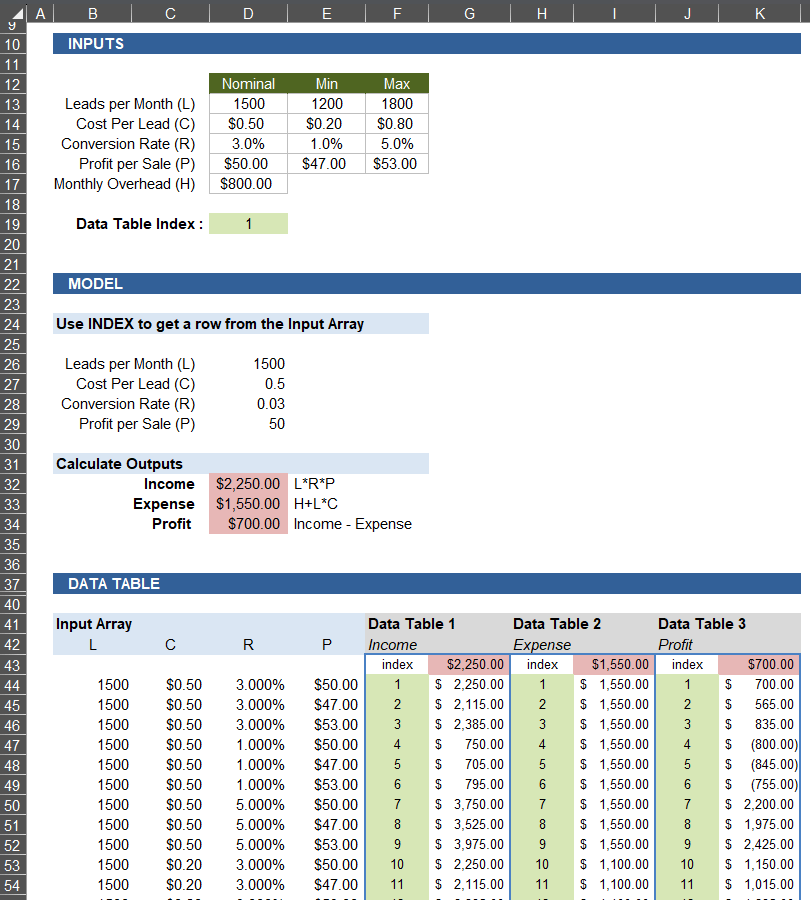
This example is included as the second worksheet in the download file, but you will need the latest update of Excel 365 for this example to work (it uses LAMBDA functions). The Input Array is generated using L_COMBINATIONS which creates an array of all combinations of Nominal,Min,Max for each variable in the inputs section.
The left column in each Data Table is just a simple counting SEQUENCE 1,2,3,...n. Your model needs to be set up so that one input is an index number that refers to a particular row in the Input Array (cell D19 in this example). The row containing the values used by the model for these other inputs is pulled from the Input Array using =INDEX(input_array,index,0).
Multiple Correlated Outputs: If you set up multiple Data Tables, each one updating the input cell D19, then you can evaluate multiple outputs using the same combinations of inputs. Your Input Array would need to consist of fixed values (not automatically regenerated random values) if you want your outputs to be correlated.
The problem with this approach is that if you have 3 outputs, you need 3 Data Tables which requires Excel to run your model 3 times for each set of inputs. This brings us to Method #2.
x-D Method 2: Storing Multiple Values in a Single Cell
A Data Table is limited to a single cell for the input and a single cell for the output (I've tried various methods of using arrays). However, if there was a way to encode multiple values into a single cell, then perhaps we could "game the system" and get the Data Table to work with multiple values at a time.
There IS a simple way to encode multiple values into a single cell: the ARRAYTOTEXT function. I thought of this idea after working with some complex number formulas, which store complex numbers as text like "0.6666666667+1.2222222222i". There is some loss of precision, but that might not be an issue very often, depending on the application.
ARRAYTOTEXT will take multiple values and convert them to a text-based string separated by commas.
A1=5
B1=10%
C1=$7,230.00
D1=ARRAYTOTEXT(A1:C1)
Result: "5, 0.1, 7230"
Now we have a way to take multiple values and store them in a single cell. We can do this with both the inputs and the outputs.
But, we also need a way to convert the text back to numeric values. That is also pretty simple, using TEXTSPLIT and VALUE.
To convert the string created by ARRAYTOTEXT back into separate cells, we just use the formula =VALUE(TEXTSPLIT(D1,", ")) like this:
D1="5, 0.1, 7230"
E1=VALUE(TEXTSPLIT(D1,", "))
Result: E1=5, F1=0.1, G1=7230
This process involves a few more steps when setting up the data table, but it's not too complicated if you have an example to work from.
Setting Up the Model for an x-Input/y-Output Data Table
We'll use a fairly basic example to show how to set up a 4-Input/3-Output data table. This can be extended to more values, limited only by cell character limits, memory, processing power, etc.
Below is an example of a very basic model showing the inputs section and the model section for a fictitious lead generation and sales forecast.
You can download the sample file here:
There are three really important steps required for setting up an x-Input/y-Output scenario:
1. Create a Data Table Input using ARRAYTOTEXT
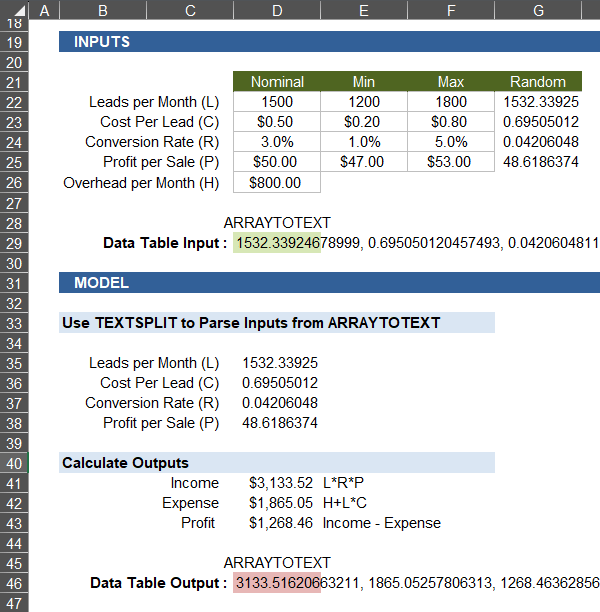
This example is doing a Monte Carlo Simulation, so the input cell D29 that will be used by the Data Table is highlighted green and uses the formula =ARRAYTOTEXT(G22:G25)
2. In the Model section, use the values from the Data Table Input
Our model needs to use the inputs from cell D29. It can use other inputs as well. Before calculating the outputs, we need to parse the values from the text string in cell D29 into separate cells.
Cell D35 contains the formula =TRANSPOSE(VALUE(TEXTSPLIT(D29,", "))) which spills down to fill cells D35:D38. Mission accomplished.
The output section then contains formulas that reference cells D35:D38.
3. Create an Output using ARRAYTOTEXT
Just like with the inputs, cell D46 uses the formula =ARRAYTOTEXT(D41:D43) to store all 3 output values into a single cell. Cell D46 is the output that will be used by the Data Table.
Setting Up the x-Input/y-Output Data Table
Now that we have the model set up, we need to do a little extra work in preparing the Data Table:
- Prepare the inputs for the data table
- Create the Data Table
- Parse and analyze the outputs
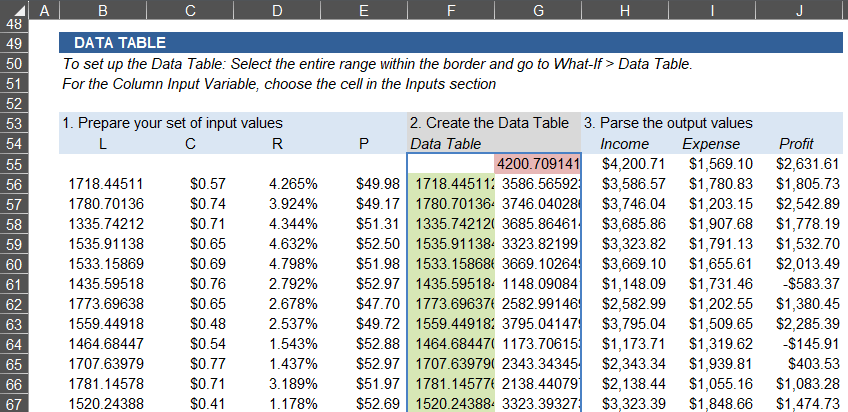
1. Create an Array of Input Values
The array of inputs consists of a column for each of the 4 inputs we are using in this analysis: L, C, R, and P.
Monte Carlo Simulation: This example is a Monte Carlo Simulation, so each of the inputs is a randomly generated value between the Min and Max from the inputs section.
Experimental Designs: You can define the inputs however you want, which could include formal statistical experimental designs, such as a full factorial design. The L_COMBINATIONS function in the new LAMBDA Library is a function that you can use to generate an array of all combinations of values from multiple arrays (used in the second worksheet in the download file).
2. Create the Data Table
The cells in green use the formula =ARRAYTOTEXT(B56:E56) copied down. The cell in red is linked to the output cell defined in our model section. You then create the data table the same way that is described above.
3. Parse the Outputs
We have 3 outputs in this example: Income, Expense and Profit (in that specific order). Cell H55 contains the formula =VALUE(TEXTSPLIT(G55,", ")) and this is copied down.
That's it! Pressing F9 will recalculate the worksheet, updating all of the inputs and re-generating the data table and the results.
Parting Comments
The Data Table in the Monte Carlo Simulation example consists of 100 rows, and even with a model this simple, the recalculation is a bit slow (still under 1 second).
You do not need to use an x-Input setup to do a Monte Carlo Simulation. That was just what I used for this example. If you don't need to store the values of the inputs, your model can generate random values and just kick out the output(s). Your input column for the data table could just be a counting sequence.
What about 2D Data Tables? A row-and-column type 2D Data Table may still be convenient, but you can use this 2-Input/1-Output setup to get the same results. It would just contain all combinations of variable 1 and variable 2 within two columns instead of a 2-D Table.
LAMBDA Functions: You can use the L_COMBINATIONS function to generate the input array. The L_LINSPACE is also a convenient function for generating linearly spaced input sequences. The L_RESCALE function can be useful for scaling values for doing sensitivity analysis. These three functions are included in the download file.
Thanks for reading, and I hope this has been useful, or at least illuminating.


Comments