◄ Return to the Gantt Chart Template Page
I was recently asked if my Gantt Chart Template could be used to compare actual dates to original project dates. The simple answer is "yes, depending on how you want to show the difference." In this post, I'll explain how you can do this using the new version of the Gantt Chart Template Pro that makes it easy to see visually.
1. Keep a Backup Copy of the Original Project Plan
Keeping a backup is always a good idea, and this is the most basic approach for keeping a record of the original plan. You can view files side-by-side or compare printouts.
2. Make a Copy of the Gantt Chart Worksheet and Rename It
You can make a copy of the Gantt Chart worksheet within the same workbook and rename the worksheets GanttChart-Actual and GanttChart-Plan (see the image below). Of course, these worksheets will be entirely independent, but it's an easy solution for keeping a copy of the original project plan. This still doesn't provide a good solution for easily comparing planned and actual dates, though.
Screenshot showing separate Plan and Actual worksheets
3. Add New Columns for Storing the Original Dates
It's easy to insert new columns in the XLSX version of the Gantt chart. Many people do that to add a budget column, and in this case you could add columns to keep track of original start and end dates.
With the new columns, you can compare dates side-by-side, but that still may not be as visual as you'd like.
4. Showing the Original Dates in the Gantt Chart
The first two approaches don't make it easy to visually compare differences between the planned and actual dates. The third method gets us part way there, but many people have wanted to see the differences in the Gantt Chart itself.
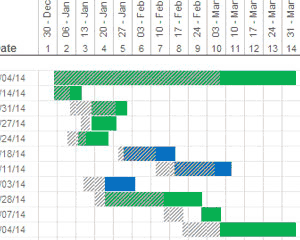
Thanks to Excel 2007+, which provided a more powerful set of conditional formatting rules than Excel 2003, it is possible to show the planned and actual project dates within the same chart. The screenshot below shows a new feature of Gantt Chart Pro that provides an option for displaying original dates as a diagonal fill pattern.
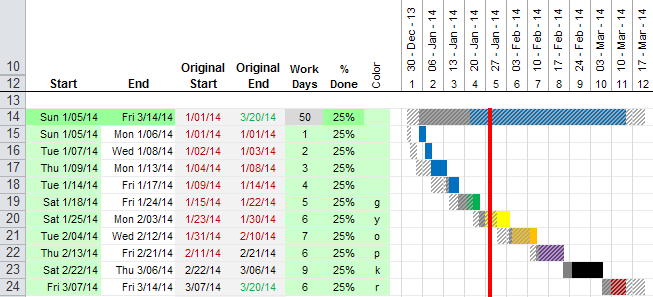
Screenshot showing a comparison of the actual vs. original dates in the Gantt Chart Pro version 4.0 (click to view larger image)
You'll see that this new version includes two new data entry columns: Original (or Planned) Start and Original (or Planned) End. After you create your plan using the normal approach, you can copy the dates from the Start and End columns into the two new columns using Copy and Paste Special > Values.
You can hide the Original Start and Original End columns if you do not want to use them or display them. You can also turn on/off the display of the original dates in the Gantt Chart by unchecking a box or using a drop-down option.
Current customers can return to the download page for Gantt Chart Pro to get a copy of the new version.
Planned vs. Actual in Google Sheets and Excel Online
Update 3/19/2019: Although cross-hatching isn't currently possible as a conditional formatting option in Google Sheets (or Excel Online), I figured out how to implement it using text ("////"). So, the Pro version includes the option to display the original planned schedule, as demonstrated in the image below.
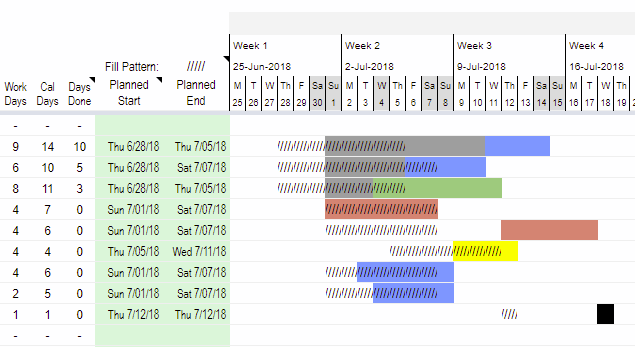
Screenshot showing Planned vs. Actual dates in Google Sheets
Let Me Know What You Think
If you would like to comment on this feature, or offer suggestions, please do so using the Comments section below.


Comments
When I modify my start date, the rest of the tasks (and the end date) are not modified accordingly.
What did I do wrong?
Thank you.
@Bruno – Maybe you need to go to Formulas > Calculation Options and set it to Automatic.
Hi
I recently purchased Gantt Chart Template Pro and I’m trying to use the pva version with Excel 365. The Gantt chart is not giving any visual detail of planned vs actual start and end dates.
Please advise.
Regards
Kevin
@Kevin, It is difficult for me to know what is going on without seeing your file. For example, perhaps you didn’t put dates in the Planned Start/End columns? Probably best to contact via email and attach a copy of your edited file. Thanks, Jon.
This is a great website! I was able to create a Gantt chart using your tutorials. I am having an issue though showing planned vs actual in my Gantt. How can I display the conditional formatting if the actual end date has not yet occurred? I would like the conditional formatting bar to show from actual start to today if actual end hasn’t come to pass yet. Currently I have set the formulas for conditional formatting of the actual dates to be blank if actual end is blank. Below is the formula I am using for actual dates (the “F” column is Actual Start, the “G” column is Actual End, and “K$5″ is Today):
=AND($F6″”, $G6″”, K$5>=$F6,K$5<=$G6)
In the End Date for the Actual column, you could use the TODAY() function.
That didn’t really work. I was trying to show Actual Start and Actual End, but if Actual End has not occurred yet, then Actual Start to Today. I figured it out though and inserted an IF function to the mix. The solution is below:
=IF($G6=””,AND(K$5>=$F6,K$5<=TODAY()),AND($F6″”, $G6″”, K$5>=$F6,K$5<=$G6))
Hi,
When entering the actual dates, planned dates are also changing automatically to the actual dates. How can I fix the planned dates without changing.
Please advice.
@Kanan, make sure that at least one set is dates only, without any formulas.
Dear Vertex42 Team, A big congrats and thanks for the awesome Gantt program on Excel, I work with the Pro version for few hours and it is really powerful using excel tables. Thanks a lot for making such great work and make it available to the market. Actually, one remark, going through the function of Planned vs Actual, in the text above you mentioned that “You can hide the Original Start and Original End columns if you do not want to use them or display them. You can also turn on/off the display of the original dates in the Gantt Chart by unchecking a box.” This is exactly what I was looking for, the possibility to show / hide the baseline depending on the audience or the focus. Is this box exist in the v4-0_pva? I cannot find it in any sheet. If not how to create it? Many thanks in advance for your feedback
That option might only be available in the O365 and GS versions.
Hi,
I just got the pro version as it had a planned versus actual excel template. However it does not offer that feature. Can you explain if I am missing something?
Thanks
@Daniel, The “planned vs. actual” version is one of the downloads. Look for the download labeled as planned vs. actual with filename “…pva” I believe.
Hello, I will be really interested to have the version with actual Date Vs. Planed Date. can I have it?
Thnk’s
Hi there, I’m using the excel template version of your project planner and finding it really useful…. I ‘ve added some ‘shapes= diamonds’ to show milestones/ meetings but these don’t scroll with the weekly scroll bar. Can the shapes be fixed so they will move with the date they are placed on using your weekly scroll bar ? Many thanks Alex
If you manually add to the gantt chart, overwriting the formulas that are already contained in the cells, that will mess things up. In Gantt Chart Pro, the diamond shape is an option in the “Color” column.
Dear Dr. Wittwer:
I bought your 2010 beta version a while back. At one point, I was able to figure out how to modify the date range above the progress bar to show the entire project timeline only and not extend beyond the completion date for viewing purpose. At the present time, I completely forgot how to modify it. Would you be so kind remind me how to perform this task please. Thanks in advance for your help.
Sincerely,
John Nguyen
The only way to do that with in the pro version is to use the display option to change to weekly/monthly/quarterly etc. See this post.
Hello Dr. Wittwer,
I’m using your Simple Gantt Chart template to keep track of tasks. Is there a way to filter out weekends and/or holidays? I thought about using the WORKDAY() function or NETWORKDAYS() function, but not sure how.
Thank you so much in advance!
Best,
M
See the video series about how to make a gantt chart if you want to try doing this yourself, or the Pro version has these functions already built in.
How can i Have this magnifique project?
Hi,
I have created a gantt chart following the tutorial video on youtube,
I only want to add the Planned vs Actual Date feature to my chart but does not know how to recreate the formula shown on the Gantt chart Pro.
Can you give me a walkthrough of how to recreate that feature please?
Sorry, I don’t have a walkthrough for that feature starting from the youtube video. But all you’re doing is creating a second set of bars using a separate set of start/end dates, and then changing the format to a cross-hatch instead of background fill.
I have multiple item code in one project. So how can make the giant chart or dashboard as plan vs actual
Sorry, but I’m not understanding why there is a question about that. Each task (item code) has it’s own line. What do you mean by “giant chart or dashboard”? What are you wanting to see on the dashboard? If it’s not the gantt chart, then you’ll probably need to create a custom dashboard.
Was this template ever completed/shared or listed to purchase? I would like to get it if possible.
Planned vs. Actual is a feature of the latest version of Gantt Chart Pro. The “Planned” columns are hidden by default.