◄ Return to the Gantt Chart Template Page
Today I created a new version of the Gantt Chart Template (Pro) designed to work in Excel Online, Excel 2010+, and Excel for iPhone/iPad. Though quite a few changes were made, most of the functionality is still there.
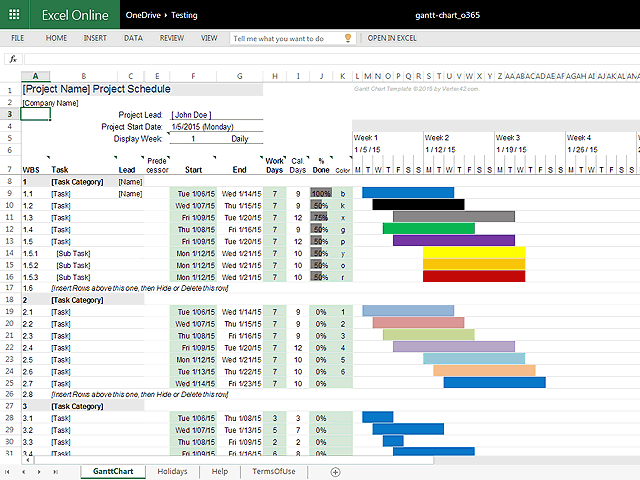
Screenshot of the Gantt Chart Template for Excel Online.
Completion Status: One of the main differences is that the completion status is shown as a progress bar in the % Done column rather than changing the bars in the chart area.
Customize the Work Week: This version uses the WORKDAY.INTL() and NETWORKDAYS.INTL() functions that let you define exactly which days of the week should be considered non-working days. See the Help worksheet if you want to define the work week as something other than Monday-Friday.
Highlighting the End Date: Another new feature allows you to highlight the End date red when the task is overdue. This feature can be turned on or off in the Help worksheet.
Displaying Dates in d/m/yy Format: Another option in the Help worksheet lets you switch between m/d/yy and d/m/yy display formats. Note that this is only a formatting switch. How you ENTER or EDIT dates will depend on your computer's system settings.
Weekly and Monthly views: Excel Online does not currently support vertically oriented text. It also had trouble with the number of columns that the original XLSX version used. This required a significant change to the way the chart is labeled. A consequence of this change is that the Weekly and Monthly views are less precise, meaning a week or month containing a 1-day task has a bar that is the same length as a week or month containing a 5-day task.
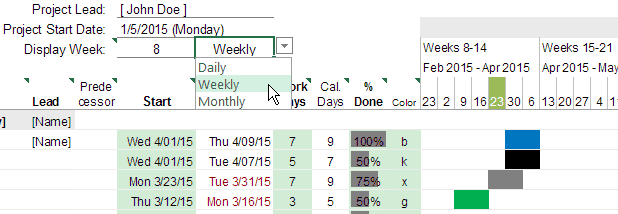
Choose a Daily, Weekly, or Monthly View (currently showing the Weekly view)
In the weekly view (shown above), the date shown in the column label is the date for Monday of that week. Another thing to notice in the above screenshot is that the week containing today's date (March 26th) is highlighted green (Monday is March 23rd).
If you want to change the range of dates shown in the chart area, you can change the Display Week number. For example, if the project start date is 1/5/2015, changing the Display Week number to 2 will make the display start at 1/12/2015. In the above screenshot, Display Week 8 means that chart begins with 2/23/2015. In previous versions, changing the range of dates was done using a scroll bar, but scroll bars are not supported in Online Excel.
An Alternate Version, Not a Complete Replacement
This new version is a new download option, but Pro version customers can still download the older versions if they are using older versions of Excel. What you use may depend largely on the version of Excel you and the others on your team are using.
Need help returning to the download page? Follow these instructions.


Comments
Hi
I cant seem to find the switch for the below task.
Highlighting the End Date: Another new feature allows you to highlight the End date red when the task is overdue. This feature can be turned on or off in the Help worksheet
Assuming you already checked the Help worksheet thoroughly for that option … which file are you using (the exact filename)? Or email to provide more specific details.
Right now it shows 8 weeks as the default view and to see the remaining weeks I have to use the upper left and right arrow to see 9th 10the weeks
how do I change the view so that instead of 8 weeks it shows a total of 9 weeks so that I do not have to use the left and right control to see the 9th week?
You’ll need to increase the number of columns by copy/pasting. See this page: https://www.vertex42.com/blog/help/gantt-chart-help/gantt-chart-support.html#columns
Dear Dr. Wittwer:
Is there a way to adjust the calendar date range above the progress bars to show the entire assigned project timeline and not extend beyond that? For example, my project is 1 week or 1 month long, I just wanted the dates to show the entire 1 week or 1 month rather than 1 year or 2 years. Thanks in advance for your help.
Sincerely,
John Nguyen
I suppose you could hide the extra columns.
Does this template work with the 2022 calendar?
@Kate – It’s completely separate from other calendar templates.
How can I combine tasks planned on weekdays and other tasks that only can be done during the weekend in one single project using this template?
@Peter … I’m not sure why that would be a problem. You can choose to enter task start and end dates. In Gantt Chart Pro you can also define each task duration as either work days or calendar days (multiple ways to define a task).
How can I divide the time for the same task – for example plan 50% of the task at the beginning of the month and return to the same task (50% the balance) at the end of the month.
I’d like to receive an answer
You could split the task into two separate but linked tasks.
Hi
Can the amount of weeks that are displayed be increased, at the moment the example I have only shows 5 at a time, can this be changed ?
Regards
Derek
Yes, especially in the newer version of Gantt Chart Pro. Columns can be added via copy/paste, also. See this post: https://www.vertex42.com/blog/help/gantt-chart-help/gantt-chart-support.html
Hi,
Is there a way to create a gantt chart for shift cycle like 14 days on/7 days off or 10 days on/4 days off? That means duration will automatically skip the days off and continuous on to working days until duration is complete.
Thanks in advance.
Interesting … I haven’t had a request like that before with regard to gantt charts. There isn’t a function in Excel like NETWORKDAYS or WORKDAYS for shifts like that. I have other rotation schedule templates that deal with these types of shifts, though: https://www.vertex42.com/ExcelTemplates/rotation-schedule.html