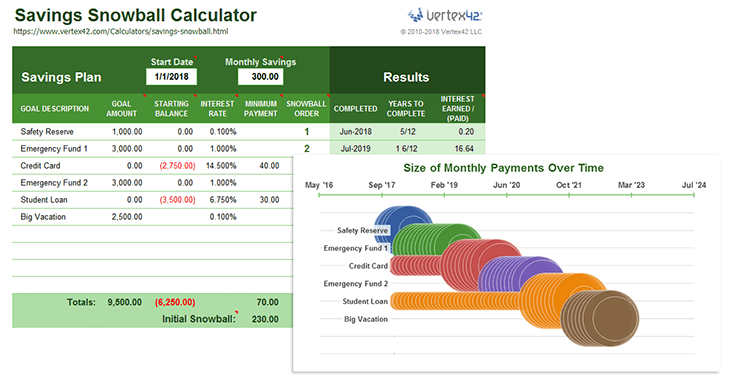
The new Vertex42 Savings Snowball Calculator is a powerful tool that helps you answer the following key questions:
- How long will it take me to reach my savings and debt payoff goals?
- What would happen if I saved a little bit more?
- How much should I contribute to each goal each month?
How should I prioritize my financial goals?
You'll need some idea of how to answer this question before using the savings snowball calculator. You can get some guidance from most personal finance books, blogs, and workshops, or you might get a financial advisor to help you.
Your financial goals might be as simple as "Save $1000, Start an Emergency Fund, Pay off my Credit Cards." Whatever the case might be, the whole purpose of the Savings Snowball Calculator is to give you a simple tool to evaluate your plan and put it into action.
Although people may find other uses for this spreadsheet, I created it to allow a person to make a plan for:
- Creating a Safety Reserve - an amount typically kept in a checking account to handle variable expenses
- Creating an Emergency Fund - to handle larger unexpected expenses for a period of unemployment
- Paying off Consumer Debt - because getting rid of debt may be better than other investment options
- Reaching other short-to-mid-term financial goals - college, vacation, down payment on a home, etc.
First, I'll explain the Savings Snowball concept and provide some background on how it was developed from the Debt Snowball. Then, I'll show some of the features of the spreadsheet. After that, if you have any comments or questions, feel free to comment below.
What is a Savings Snowball?
Put simply, a savings snowball is a strategy that involves focusing on one financial goal at a time. You first need to create a budget and figure out how much you can put towards savings each month. You may decide to allocate some of your savings to a few different goals (referred to as Minimum Payments in the spreadsheet). The monthly savings left over after making the minimum savings payments is called your Savings Snowball and you apply it to your highest priority goal first.
After you've completed your first goal, you apply the savings snowball to the next one. For example, let's say your second goal is to pay off a credit card. If you have been making monthly $30 payments on that card, after you have paid it off you can add the $30 to your snowball, speeding up the process of completing your next goal.
How does a Savings Snowball compare to a Debt Snowball? It is almost exactly the same concept, mathematically. The main practical difference is that savings accounts have horrible interest rates, so while the debt snowball has a lot to do with interest rates, the savings snowball is more wholistic and focused on prioritizing and reaching goals.
A savings goal might be to reach $1000 starting from a balance of $0. A debt payoff goal would be to reach $0 starting from a balance of -$1000 (note the minus sign). In this spreadsheet, a debt is simply a negative balance that you are trying to bring up to zero.
The origin: The idea of a savings snowball is not unique. In fact, the general idea has probably been around for millenia. The phrase "savings snowball" is just a more modern term that became popular because of the popularity of the "debt snowball."
Soon after I created the Debt Reduction Calculator nearly a decade ago, I started getting requests for a spreadsheet that could extend the process to savings.
Most of these requests came from people using a debt snowball who realized "Hey, this ought to work for savings, too! Do you have something like that? I'd like to roll my debt snowball into a savings snowball." So, I created a basic savings snowball spreadsheet in 2010 and shared it with a few people over the years.
It wasn't until recently, after helping with a short-course on personal finance, that I realized how useful it could be to have a calculator that handled both savings AND debt payoff goals in any order or combination. After all, you don't typically want to aggressively pay off debt until you have a decent safety reserve and a start on an emergency fund.
The Payment Schedule
When creating a budget or "spending plan," we often refer to savings allocations as "payments" even though they might just be transfers from our checking account to our savings account. In the spreadsheet, these monthly payments to your various savings and debt payoff goals can be seen in detail via the Payment Schedule worksheet:

The Schedule worksheet allows you to list occasional Extra Savings, shown in the example above as the two $250 amounts on rows 34 and 45. To stick with the snowball theme, the strategy of making occasional extra payments above your normal budgeted total savings is referred to as snowflaking (see What is a Debt Snowflake?).
Note! Results are only estimates. The spreadsheet assumes fixed interest rates and monthly compounding, so while the approximations may be pretty good, the results won't match your account statements penny for penny.
The Savings Snowball Charts
I created two different graphs in the spreadsheet to visually represent the monthly payments over time for each of the separate goals. Unless you are a spreadsheet nerd like me, you probably won't care how these were created, but they represent a unique type of chart that I made specifically to show the snowball effect.
The first graph was created using a Bubble Chart - one of the built-in chart types in newer versions of Excel. The size of the bubbles show the relative size of the monthly payments. The horizontal axis shows the dates of the payments.
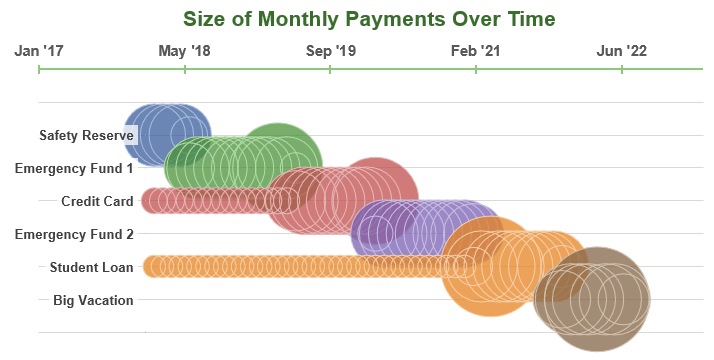
The goals in this graph are listed in order of priority with the snowball being applied to the top goal first. You'll see that as each goal is completed, the snowball payment is applied to the next goal.
Notice that for the credit card and student loan, only small monthly payments are made at first, but after the snowball is rolled into those goals, they get paid off pretty quickly.
I figured a snowball chart might be cool to show with circles, but the engineer in me complains about the fact that the snowballs are overlapping each other (making the interpretation of the graph difficult). So, I think the next graph is the best one.
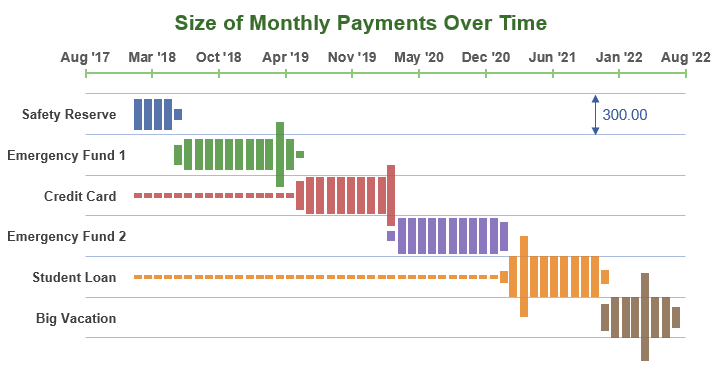
In this second chart, the distance between the gridlines represents the total monthly savings. The vertical width of each of the bars represents the size of the monthly payment.
You can see more easily with this graph how the full $300/month is allocated.
You can also easily see where the extra annual $250 payments are occurring (because the bars are wider than the $300 gridlines).
What Do You Think?
If you have any questions or comments related to the savings snowball concept in general or how to use (or interpret) the spreadsheet, please comment below.


Comments
1) I love your Lucid programs. Disgusted with Microsoft, haven’t been able to open corrupt Office 365 for a year and Microsoft can not reinstall unless I pay $125.00. I already paid $69 and can’t use.
2) I plan to start using Vertex and Open Office, but have concerns that your copies of excel etc may not be available if i do not purchase Office 365 again.
@Gene … 1) I’m personally still a fan of paying for Excel directly rather than subscribing through Office 365 … but that’s just me. 2) Unfortunately, this Savings Snowball Calculator is an example of a spreadsheet that is not compatible with OpenOffice. I was able to make a couple versions that work in OpenOffice and Google Sheets, though without the full functionality of the graphs. Excel is definitely superior when it comes to creating spreadsheets with as many calculations as this one has. The Google Sheets and OpenOffice versions take a long time to recalculate.
I added more lines to the calculator to list all our goals, but after the tenth one the results columns just have hashes in them. I’m probably just missing something easy. Any ideas why this is?
@Kim, It is not sufficient to just add more rows. There are many other things that would need to be modified. Because this spreadsheet does most of what the original Debt Reduction Calculator does, if I create a version that allows more than 10 goals, I will need to sell it with the extended version of the D.R.C.
Hi – Is it possible to make the sheets part of one of my Excel files? I keep all finances (budgets, reports, etc in one file and would like to copy the pages into that file.
@Phoebe, Not easily, no. Might be easier to move other budget worksheets into the savings calculator.
Hi,
I entered my loans and have a schedule to pay off my debt. Two of the payments are displayed in red. I am unable to determine why they are red and what it means
Len.
@Len If the values in red are in the Starting Balance and look like (2750.00), that means the value is negative and that is correct (for a loan). Same with interest earned (paid). A negative interest earned will be displayed as a red negative number. If it’s anything else, you’d need to be more specific, and maybe email me a screenshot or something.
I still use Office 2007. Please make this backwards compatible so I can use it. I so desperately need this spreadsheet. I need to get my 502 credit back on track from a divorce and broken finger/wrist.
@JOY … Sorry. I’m not going to make a version for Office 2007, but you can use the Google Sheets version. If you are looking for debt reduction, specifically, you could try the credit repair version (which has a link to an old Excel 2003 version): https://www.vertex42.com/Calculators/credit-repair.html
Do you have an avalanche spreadsheet that will let you input a “snowflake” payment on a certain date? For example if I want to pay an extra one time payment $100 on my student loan, I want to know the amount of interest that will save me in the long run, but the amount of interest I would save would be slightly different if I make that extra payment at the beginning of the month vs a couple weeks later. I keep trying and trying to make my own and can’t get it right.
@Trish, My debt reduction calculator allows you to enter “snowflake” payments, however the spreadsheet is not based on daily interest accrual, so it assumes that the payment is applied the same time as the normal payment. Being off by a couple weeks won’t make a huge difference in the end, which is why the spreadsheet isn’t set up to track actual payment dates. Something that might help is to think of it in terms of how much interest would accrue on your $100 payment during those two weeks (very little). You are right that there will be a slight difference, but the spreadsheet is already only making approximations, so the very small difference that two weeks might make is likely going to be lost in that noise. The power of making the $100 extra payment doesn’t come from whether you make it now or within two weeks, but rather how much interest will be saved over 5 to 10 years.
You’d have to check with the company servicing your student loan to learn whether they apply payments on the dates the payments are received, or whether the extra payments are applied with the next standard payment.
If you want to delve into the details of how daily interest accrual works and the effects of the timing of payments, you can look at the Simple Interest Loan spreadsheet.
Hi, the graph in the spreadsheet is shown as circles. Is it possible to update to the one like the 2nd graph?
@John … I don’t know what you mean by ‘update’ – the spreadsheet already has both versions of the graph.
Haha yes. It was just right below the 1st graph. Thanks!
Hi, Just starting, On snowball ways, What is the reduce to column?
Also, I just paid one of the debts off, how do I mark this so its no longer in the calculator
Thanks
The Savings Snowball doesn’t have a “Reduce To” column, so I’m guessing you are using the credit repair version of the Debt Snowball Calculator. The Reduce To column is for indicating what balance you want to reduce your debt to before moving your snowball target to the next debt in priority. The idea of that calculator is to try to reduce the debt-to-credit balance ratios before trying to reduce everything to zero.
How/Where do I enter when I have paid off a debt?
The links to the help calculator webpage do not engage.
Thanks
@Susan, You can update the balances in the main table to create a new projection. After paying off a debt, you can delete it, from the main input table. The savings snowball calculator isn’t so much for month-to-month tracking as it is for making future projections based on current balances.
I’m having trouble getting this to actually set up a payment schedule. I can’t change the year without getting Value ###### errors in the payment schedule. Or if I successfully change the year, I get the Value #### errors when I try to move around the snowball values, or eliminate the assumption that I want 3 emergency funds and a vacation fund and put in actual values for our much higher student loans. I have some variable cash coming in and I can predict it and would like to set that up in a way that the basic debt reduction calculator cannot do and this just isn’t working with me.
@Emily … ##### means that you need to make the columns wider, or use Shrink to Fit. To change the dates in column B of the Schedule worksheet, you’ll need to change the Start Date in the Calculator worksheet.
I also use OpenOffice and love the look of this spreadsheet. Are you creating anything that is compatible?
@Ruth, There is a Google Sheets version available, so I have no plans to make a version compatible with OpenOffice.
I changed the start date to 3/1/20. However, both tables show random
dates on the axis : Jan-00, Sept-13, Mar-27. Any idea why the months are not
changing per monthly payment schedule: Mar-20, Apr-20, May-20, etc?
Is the column “years completed” supposed start at 1/12?
Also, the grey box titled: Estimated tax-adjusted interest rate, what/how is this
calculating?
Thank you!
When I download a new copy of the file and change cell C6 (Start Date) to 3/1/2020, it works fine. Make sure that what you have entered is an actual date, and not just text. If you don’t enter the date in the correct format, then you will indeed see the tables and charts start at Jan’00, because Excel will not be able to convert what you have typed into a date value.
Years To Complete is showing a fraction, not a date. So 1/12 means one month and 2 3/12 means 2 years and 3 months.
Look at the formula in cell N13 to see how the Tax-Adjusted value is calculated. The purpose of M9:O14 is just to help you calculate a tax-adjusted savings rate if you want to, so that you can enter the tax-adjusted rate into column D. You don’t need to use the tax-adjusted interest rates if you don’t want to.
How do you completely delete a file? When I changed one of the cell entry, I keep on getting “you cannot change part of an array.” It won’t even let me close the Excel program. When I downloaded a new template, it did not give me a blank one but it picks up the data from my current file. It also does the same thing when I create other Excel docs. Hope you can help me. Thank you so much.
@Annie … some spreadsheets require a significant amount of Excel knowledge to customize. Working with array formulas is complicated, and if you are trying to modify the way the spreadsheet works or add rows or columns where they are not meant to be added… I’m afraid you are very likely to cause errors. I don’t know what you mean by “picks up the data from my current file” but I have no idea how that could happen, unless you are accidentally just opening the same file over again rather than downloading and using a completely new copy of the file.
What is the box to the right of the debt/savings input box that says “Estimated tax-adjusted interest rate” for? It looks to come in with Annual Rate of 2% & a Tax Rate of 20%. Where should we pull those numbers from?
@Jordan, interest earned from a typical savings account is taxed as income (in the U.S.). So, the calculation to the right is just a basic way of calculating what a “tax-adjusted interest rate” might be if you wanted to enter the tax-adjusted rate rather than the nominal rate. You may only pay the tax yearly, but it’s important to remember the effects of taxes when you are comparing interest rates across different types of investments. If are paying off a car loan with a 5% rate, you don’t pay taxes on the interest that you avoid paying. However, earning 5% interest via a taxable bond fund may result in taxes. An accountant or other finance professional could provide advice regarding taxes.
I put my car payment and a student loan in two of the rows, but it’s not calculating right.
Student Loan 0.00 (6,186.78) 6.750% 88.25 4 – – error
Wellby 0.00 (18,771.28) 2.740% 346.72 6 – – error
Those are the two rows I’m working with. It may be best if I start over.
Thank you,
Theresa
@Theresa, Hard to know what might be wrong without seeing your actual file and knowing what you are comparing to. But yes, starting with a new worksheet may be best if you overwrote a formula somewhere by accident.
Hi Jon, I love this, thanks for making it available. I am paid fortnightly – just wondering if there is a way to change ‘monthly payments’ to fortnightly so I can allocate the saving/budget fortnightly? Or should I just do this by adding in a snowflake payment each month. Thanks, Sherryl
It’s possible to change it to fortnightly but not easy and I don’t have an example to share. I think it’s mostly a matter of modifying inputs, labels, and the interest calculations (using apr/26 instead of apr/12), and probably the date calculations. So yes, probably easier to just figure out what the equivalent monthly payment would be or use snowflakes.