Critical Path Method - CPM & PERT
The Critical Path Method (CPM) provides a way for project managers to determine which tasks are critical (zero slack time) and which tasks can be delayed (and for how long). Normally, you would need specialized software such as MS Project, but not any more. Now you can simply download my CPM spreadsheet that implements the CPM algorithm in Excel. If you can copy and paste, enter data into cells, and follow a few simple guidelines, you can do a critical path analysis with almost no learning curve.
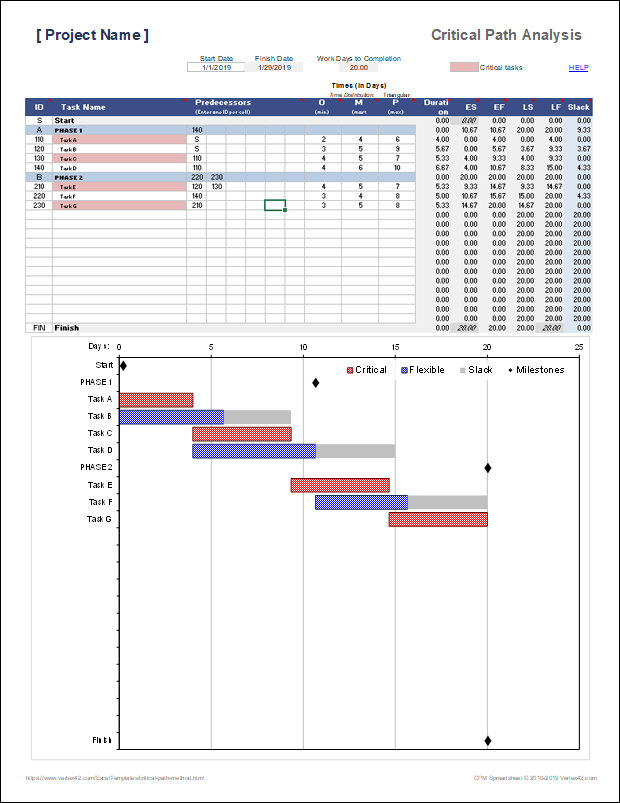
The CPM spreadsheet produces a Gantt Chart showing the critical path tasks as well as the potential delay times for the flexible tasks. You may need to be familiar with some of the basic terms used in the CPM method (see below), but the template is very easy to use and does not require you to enter formulas. Unlike my other gantt chart template, the gantt chart in the CPM spreadsheet is an actual bar chart object, and you can resize it and change font sizes to get it to display the way you want.
The gantt chart in the Critical Path Method spreadsheet is very similar to what you'd see using Microsoft Project, except that it doesn't add the lines with arrows pointing from the end of one task to the start of a successor. But, that is an extremely minor limitation compared to the benefit you'll get from the lower cost and ease of use.
Critical Path Method Spreadsheet
for Excel
Download
⤓ Excel (.xlsx)License: Private Use (not for distribution or resale)
"No installation, no macros - just a simple spreadsheet" - by Jon Wittwer
Limitations in the free version:
- 25 tasks. The pro version allows up to 500.
- 6 predecessors per task. The pro version lets you include up to 10 per task.
- Critical tasks cannot be correctly identified until all tasks have a successor. The new Pro version uses a modified algorithm that assumes all tasks have the Finish task as a successor (making it much easier to use and understand).
- Task IDs must be numbers. The pro version allows you to use text or numbers.
CPM Spreadsheet (Pro Version)
via ClickBank.net
60-DAY MONEY-BACK Guarantee
 Try it out! If you don't think it was worth the cost, I will refund your purchase.
"No installation, no macros, no VBA"
License: Private Use (not for distribution or resale)
Description
This spreadsheet implements the PERT algorithm and Critical Path Method to aid in project planning and scheduling.
This version lets you include up to 500 tasks (more upon request, if necessary).
Unlike a normal project schedule or gantt chart, this spreadsheet lets you use the statistical aspect of the PERT algorithm by defining the duration of a task using O-M-P times (Optimistic, Most Likely, and Pessimistic). You can choose to calculate the expected time (Duration) using either the Triangular or Beta distribution.
The Gantt Chart shows the tasks on the Critical Path as red bars, the flexible tasks as blue bars, and the slack time as gray bar extensions. Milestones (tasks with zero duration) are shown as black diamonds, but you don't have to mess with the axis scaling like the free version.
Task dependencies are defined by simply listing the predecessors for each task.
Update 5/7/2019 - The new version 1.2 uses an updated algorithm that assumes all tasks have the Finish task as a successor. This is a simple yet huge breakthrough that makes the spreadsheet a lot easier to use.
What is the Critical Path?
The critical path is the string of dependent tasks that limit a project from being completed faster. In other words, unless you can reduce the duration of one or more tasks on the critical path, you can't reduce the time your project will take.
There can be multiple parallel critical paths, and the critical path may change if you are able to reduce the duration of one of the critical tasks.
This spreadsheet finds the critical path using the PERT algorithm. The PERT algorithm calculates the slack time or float time for each task. Slack or float time is the amount of time the task can be delayed without causing the overall project to take longer.
In addition to identifying critical tasks, calculating slack time can help identify tasks that can be delayed, allowing a project manager to make decisions about where to allocate resources.
What is a Critical Task?
A critical task is a task that has zero slack time. That definition is based on the fact that if you delay or increase the duration of a critical task, it will cause the project to take longer.
A critical task is not necessarily a task that has another task immediately following it, because if the second task has slack time, then the first one might also. For example, if the second task could be delayed 5 hours, then the first one could be delayed 2 hours and the second task could still be delayed 3 hours.
Note: A constraint such as not being able to start a task until a certain time of day could cause what would have been a critical task to have some slack time (because of having to wait for a certain time of day to start the next task). This spreadsheet does not allow you to enter those types of constraints, so for the purposes of the spreadsheet, a critical task is simply defined as a task with zero slack time.
What is the PERT algorithm?
What I am calling the PERT algorithm is the logical and mathematical means for calculating the minimum time to complete a project, based on the Program Evaluation and Review Technique developed in the 1950s by the US Navy. For more detail, see the wikipedia article.
The terms I am using in the spreadsheet, such as critical path, predecessor, successor, float and slack come from PERT.
CPM and PERT are commonly used together, but PERT includes a statistical approach that doesn't necessarily need to be part of a critical path analysis.
The statistical aspect of PERT is implemented in the spreadsheet by allowing you to enter O-M-P times (Optimistic, Most Likely, and Pessimistic). This lets you account for some uncertainty in your estimates. You can just enter the Most Likely times if you don't want to account for uncertainty.
Note: The O-M-P approach does not give you an expected range or distribution for the Minimum Time to Complete the project. O-M-P helps calculate the expected duration for each task, and those expected durations are used to calculate the expected Minimum Time to Complete (but not the overall uncertainy).
What are Predecessors and Successors?
A predecessor is a task that must be completed before its successor task can start, without any other tasks in between. Successor tasks come immediately "after," and predecessor tasks come immediately "before."
For example, if you need to build a prototype before you test it, then "Build Prototype" is the predecessor of "Test Prototype."
Task dependencies can actually be much more complex than that, such as Task B needing to start 4 days before Task A ends. However, the algorithm in this spreadsheet uses only the basic predecessor/successor type of dependency.
Multiple Predecessors: Assigning multiple predecessors to a task means that the task will start immediately after all of its predecessors is complete. Redundancy won't break the algorithm, but avoid it. For example, if A is the predecessor of B and B is the predecessor of C (A→B→C), you don't need to assign A as a predecessor of C.
Using the Critical Path Method Spreadsheet
Although the CPM spreadsheet contains a Gantt chart, if you need to create a detailed project schedule, I would recommend using my Gantt Chart template as well.
When using the CPM spreadsheet to perform a critical path analysis, it is very important that you follow the procedures and guidelines below:
- Read the cell notes (little red triangles) for additional help if you have a question about what the column labels mean.
- You can list up to 6 predecessors by listing one ID per column.
- Each task needs to have at least one successor. The algorithm does not work otherwise.
- Do not mess with the Start or Finish rows.
- Edit only the cells with the light-gray border (The ID, Task Name, Predecessors, and Times).
- To insert a task, copy one of the rows between the start and finish events and insert the copied row where you need it to be. The spreadsheet contains hidden columns with formulas that must be copied, so it is important to use row operations rather than only inserting or copying visible cells.
- To remove a task, delete the entire row.
- You can move a row by cutting and inserting the cut row above another row.
- If you get an error, it is likely due to a circular reference error. Check your dependency relationships (predecessors).
- If a task has a duration of 0, it is defined as an Event or Milestone (shown as a diamond in the gantt chart).
- If copying WBS numbers and task descriptions from another file, make sure to only paste values, because the tasks column uses conditional formatting to highlight the critical tasks.
While you are in the process of adding tasks (in the free version): If you are wondering why tasks are marked as critical, check to see if there are any tasks highlighted yellow. All tasks need to have successors before the algorithm will correctly predict the critical path.
Interpreting the Gantt Chart
Even though the gantt chart does not show lines connecting dependent tasks, you can refer back to your table of tasks and predecessors.
For critical tasks: Look at the start of the task and see if it lines up with the end of other tasks.
The end of the slack period will usually line up with the beginning of a critical task. If it doesn't, the end of the Flexible task may line up with the beginning of another Flexible task (like Tasks F and D in the screenshots above).
Displaying all Task Labels in the Chart
If you have more than 100 tasks, the chart may show only every other task label (or fewer if you have > 200 tasks). In that case, you will need to right-click on the y-axis and go to Format Axis. Then set the "Interval Between Labels" to "Automatic." You will then need to stretch the chart taller until you see all the labels.
Hours instead of Days
Except for the calculation of the Finish Date, there are no calculations in the worksheet that are based on dates. So, if you want the times to represent hours rather than days, you can just change all labels to say "Hours" instead of "Days" and delete the Finish Date cell. When you enter the O, M, and P values, just consider them to be hours.
Printing
The template is set up initially to fit the entire analysis on a single page. If you want to do something different, then all of the Excel print settings are open to you. You can print the gantt chart separately by first selecting the chart and then pressing CTRL+p.
Behind the Scenes
If you want to see everything that is going on, you can unhide all of the columns. There is no VBA and there are no other hidden worksheets. The highlighting in the Task Name column is done using conditional formatting.
More Project Management Tools
- Gantt Chart - Create a detailed project schedule.
- Excel Timeline - Create a project timeline, showing events along an axis with leaderlines.
Critical Path Method & PERT Resources
- Critical Path Method at wikipedia.com
- PERT at wikipedia.com - A very detailed explanation of how to implement the Program Evaluation and Review Technique, using the Critical Path Method.
- Triangular Distribution at wikipedia.com.
- Beta Distribution at wikipedia.com.